29
/
en
AIzaSyAYiBZKx7MnpbEhh9jyipgxe19OcubqV5w
April 1, 2024
153040
Hungary
HUN
true
2
1
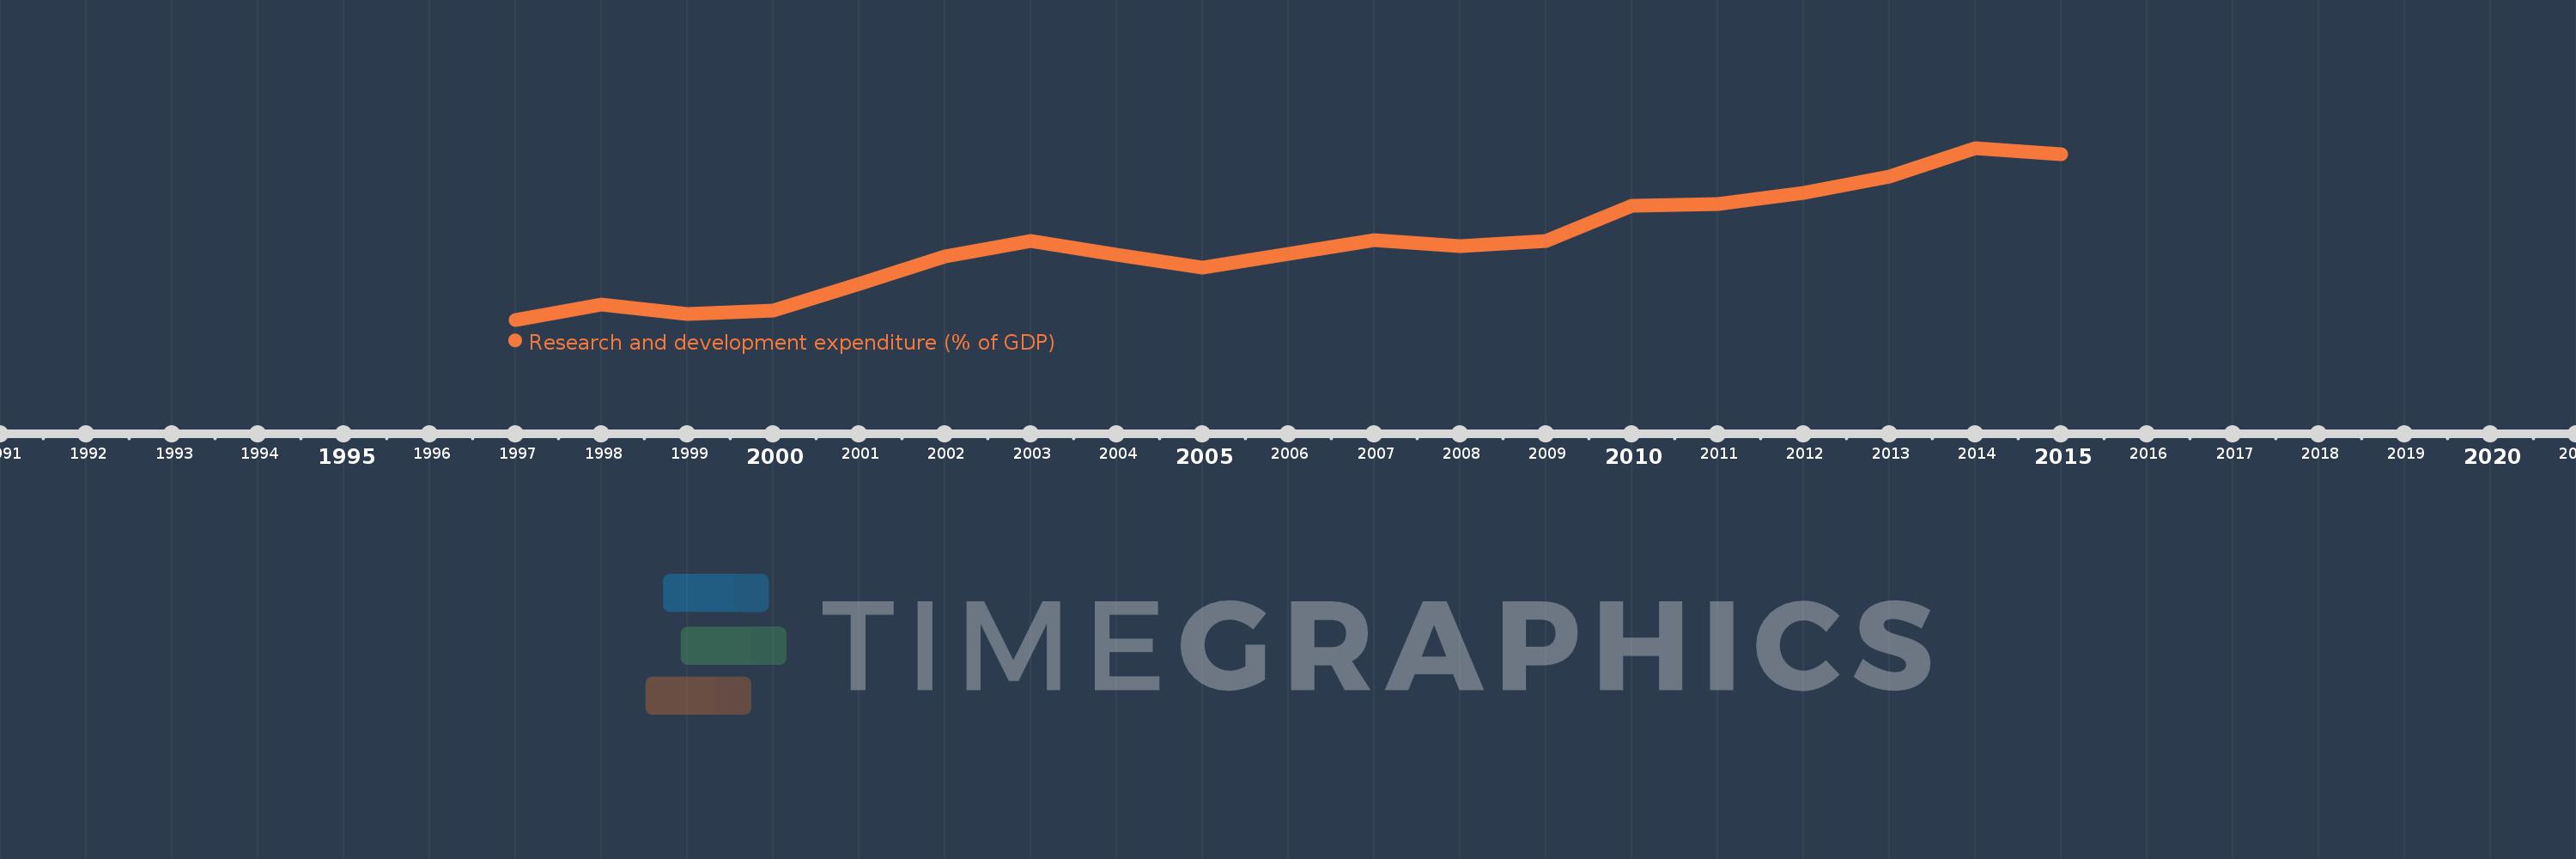
Research and development expenditure (% of GDP)
2015,2014,2013,2012,2011,2010,2009,2008,2007,2006,2005,2004,2003,2002,2001,2000,1999,1998,1997
This statistics in other country:
Timeline:
This timeline shows a graph from 1997 to 2015 of Hungary. No data until 1996. Number of actual observations by date: 19.
Source name:
World Development Indicators
Source organization:
United Nations Educational, Scientific, and Cultural Organization (UNESCO) Institute for Statistics.
Categories, topics:
Science & Technology
Last updated:
apr 23, 2017
Indicators value changes by year
At the date of observation
Value
Absolute change
Change from previous value
jan 1, 1997
0.633
+0.633
0.0%
jan 1, 1998
0.701
+0.069
10.88%
jan 1, 1999
0.658
-0.043
-6.14%
jan 1, 2000
0.672
+0.014
2.14%
jan 1, 2001
0.792
+0.119
17.75%
jan 1, 2002
0.915
+0.123
15.52%
jan 1, 2003
0.985
+0.07
7.67%
jan 1, 2004
0.922
-0.063
-6.39%
jan 1, 2005
0.864
-0.058
-6.3%
jan 1, 2006
0.925
+0.061
7.08%
jan 1, 2007
0.986
+0.061
6.56%
jan 1, 2008
0.962
-0.024
-2.41%
jan 1, 2009
0.985
+0.023
2.41%
jan 1, 2010
1.139
+0.154
15.63%
jan 1, 2011
1.147
+0.007
0.65%
jan 1, 2012
1.196
+0.049
4.31%
jan 1, 2013
1.27
+0.074
6.2%
jan 1, 2014
1.397
+0.127
9.99%
jan 1, 2015
1.371
-0.027
-1.9%
Ranking of countries by current statistics by years


Comments: