29
/
en
AIzaSyAYiBZKx7MnpbEhh9jyipgxe19OcubqV5w
April 1, 2024
243082
Slovenia
SVN
true
2
1
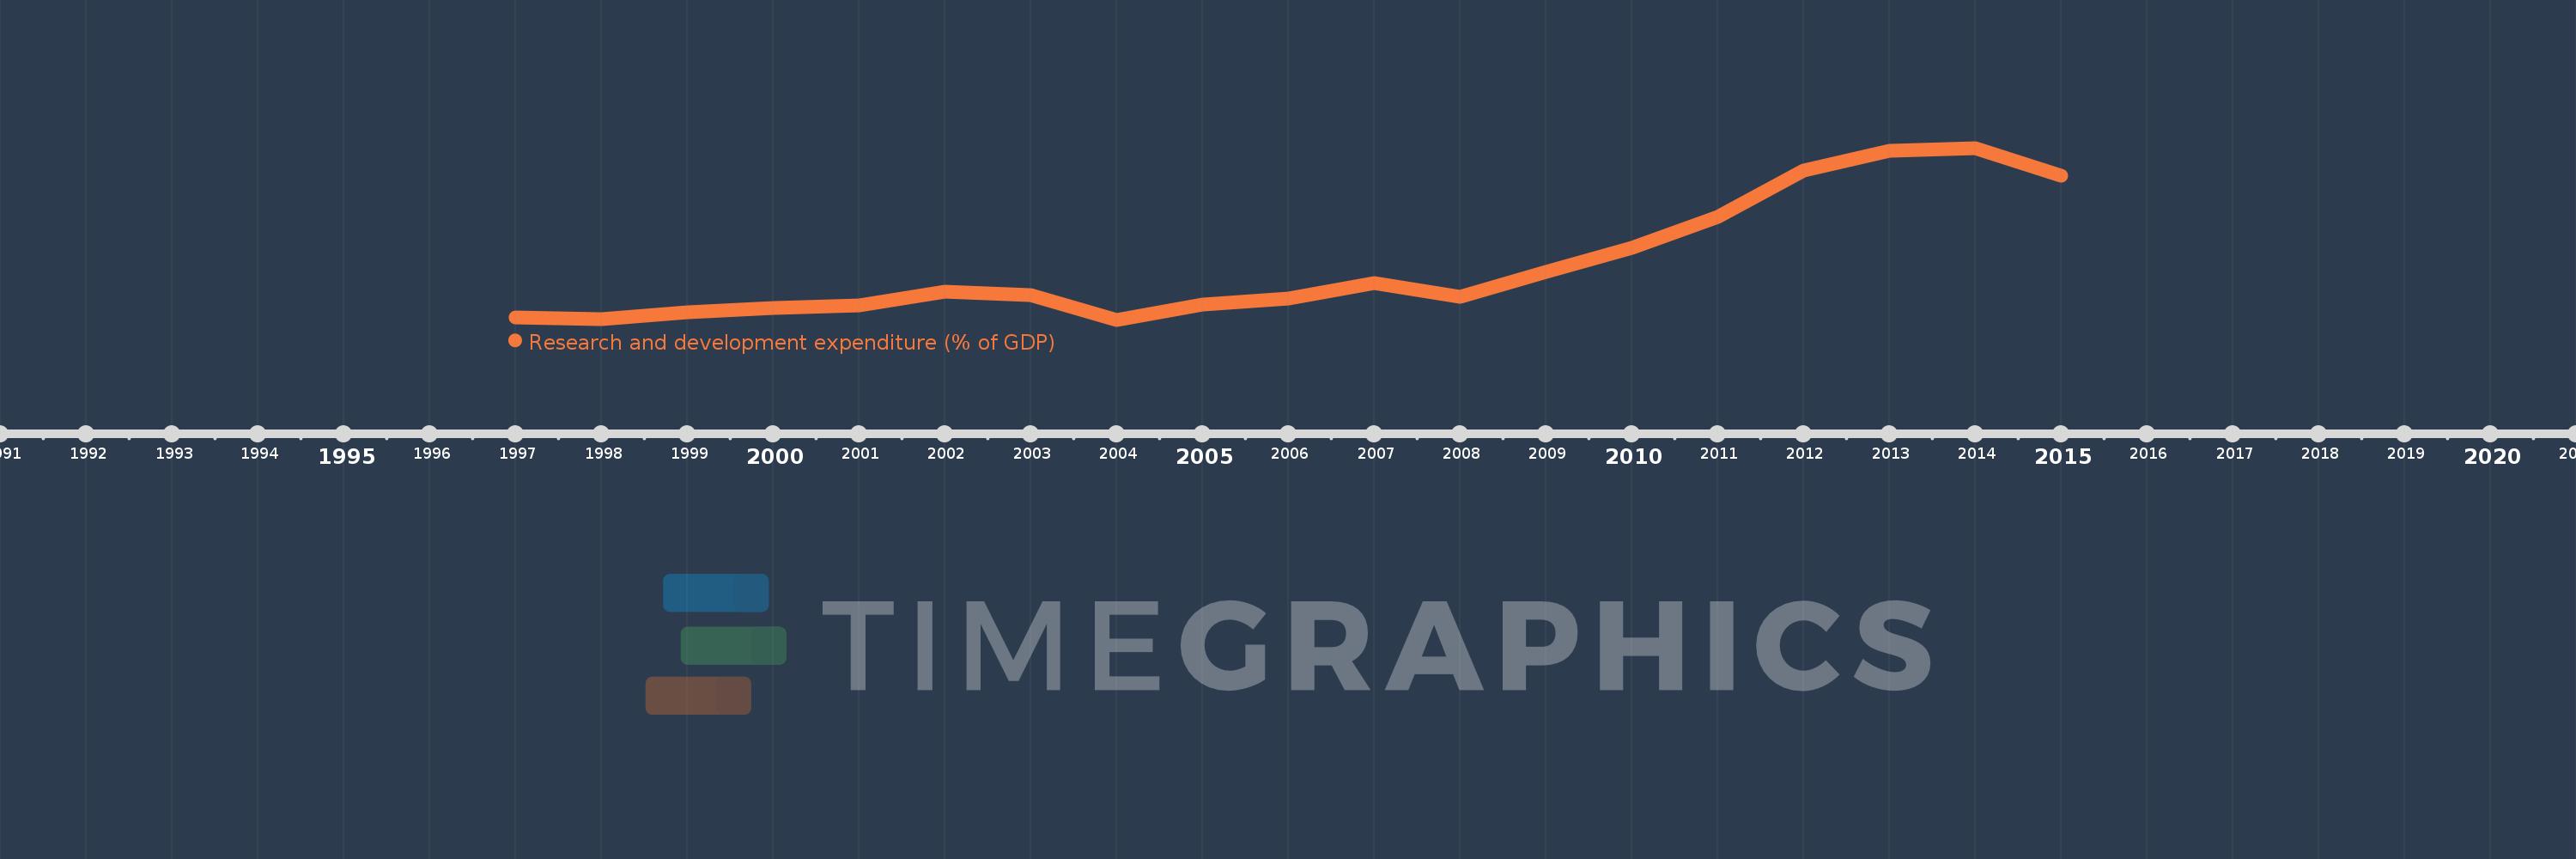
Research and development expenditure (% of GDP)
2015,2014,2013,2012,2011,2010,2009,2008,2007,2006,2005,2004,2003,2002,2001,2000,1999,1998,1997
This statistics in other country:
Timeline:
This timeline shows a graph from 1997 to 2015 of Slovenia. No data until 1996. Number of actual observations by date: 19.
Source name:
World Development Indicators
Source organization:
United Nations Educational, Scientific, and Cultural Organization (UNESCO) Institute for Statistics.
Categories, topics:
Science & Technology
Last updated:
apr 23, 2017
Indicators value changes by year
At the date of observation
Value
Absolute change
Change from previous value
jan 1, 1997
1.266
+1.266
0.0%
jan 1, 1998
1.247
-0.019
-1.51%
jan 1, 1999
1.306
+0.059
4.74%
jan 1, 2000
1.338
+0.032
2.43%
jan 1, 2001
1.356
+0.018
1.36%
jan 1, 2002
1.468
+0.111
8.22%
jan 1, 2003
1.439
-0.029
-1.98%
jan 1, 2004
1.245
-0.193
-13.45%
jan 1, 2005
1.368
+0.123
9.86%
jan 1, 2006
1.412
+0.044
3.23%
jan 1, 2007
1.533
+0.121
8.54%
jan 1, 2008
1.424
-0.109
-7.12%
jan 1, 2009
1.626
+0.202
14.17%
jan 1, 2010
1.816
+0.191
11.73%
jan 1, 2011
2.058
+0.241
13.29%
jan 1, 2012
2.424
+0.366
17.79%
jan 1, 2013
2.579
+0.156
6.43%
jan 1, 2014
2.604
+0.024
0.95%
jan 1, 2015
2.386
-0.217
-8.35%
Ranking of countries by current statistics by years


Comments: