29
/
en
AIzaSyAYiBZKx7MnpbEhh9jyipgxe19OcubqV5w
April 1, 2024
274253
Ukraine
UKR
true
2
1
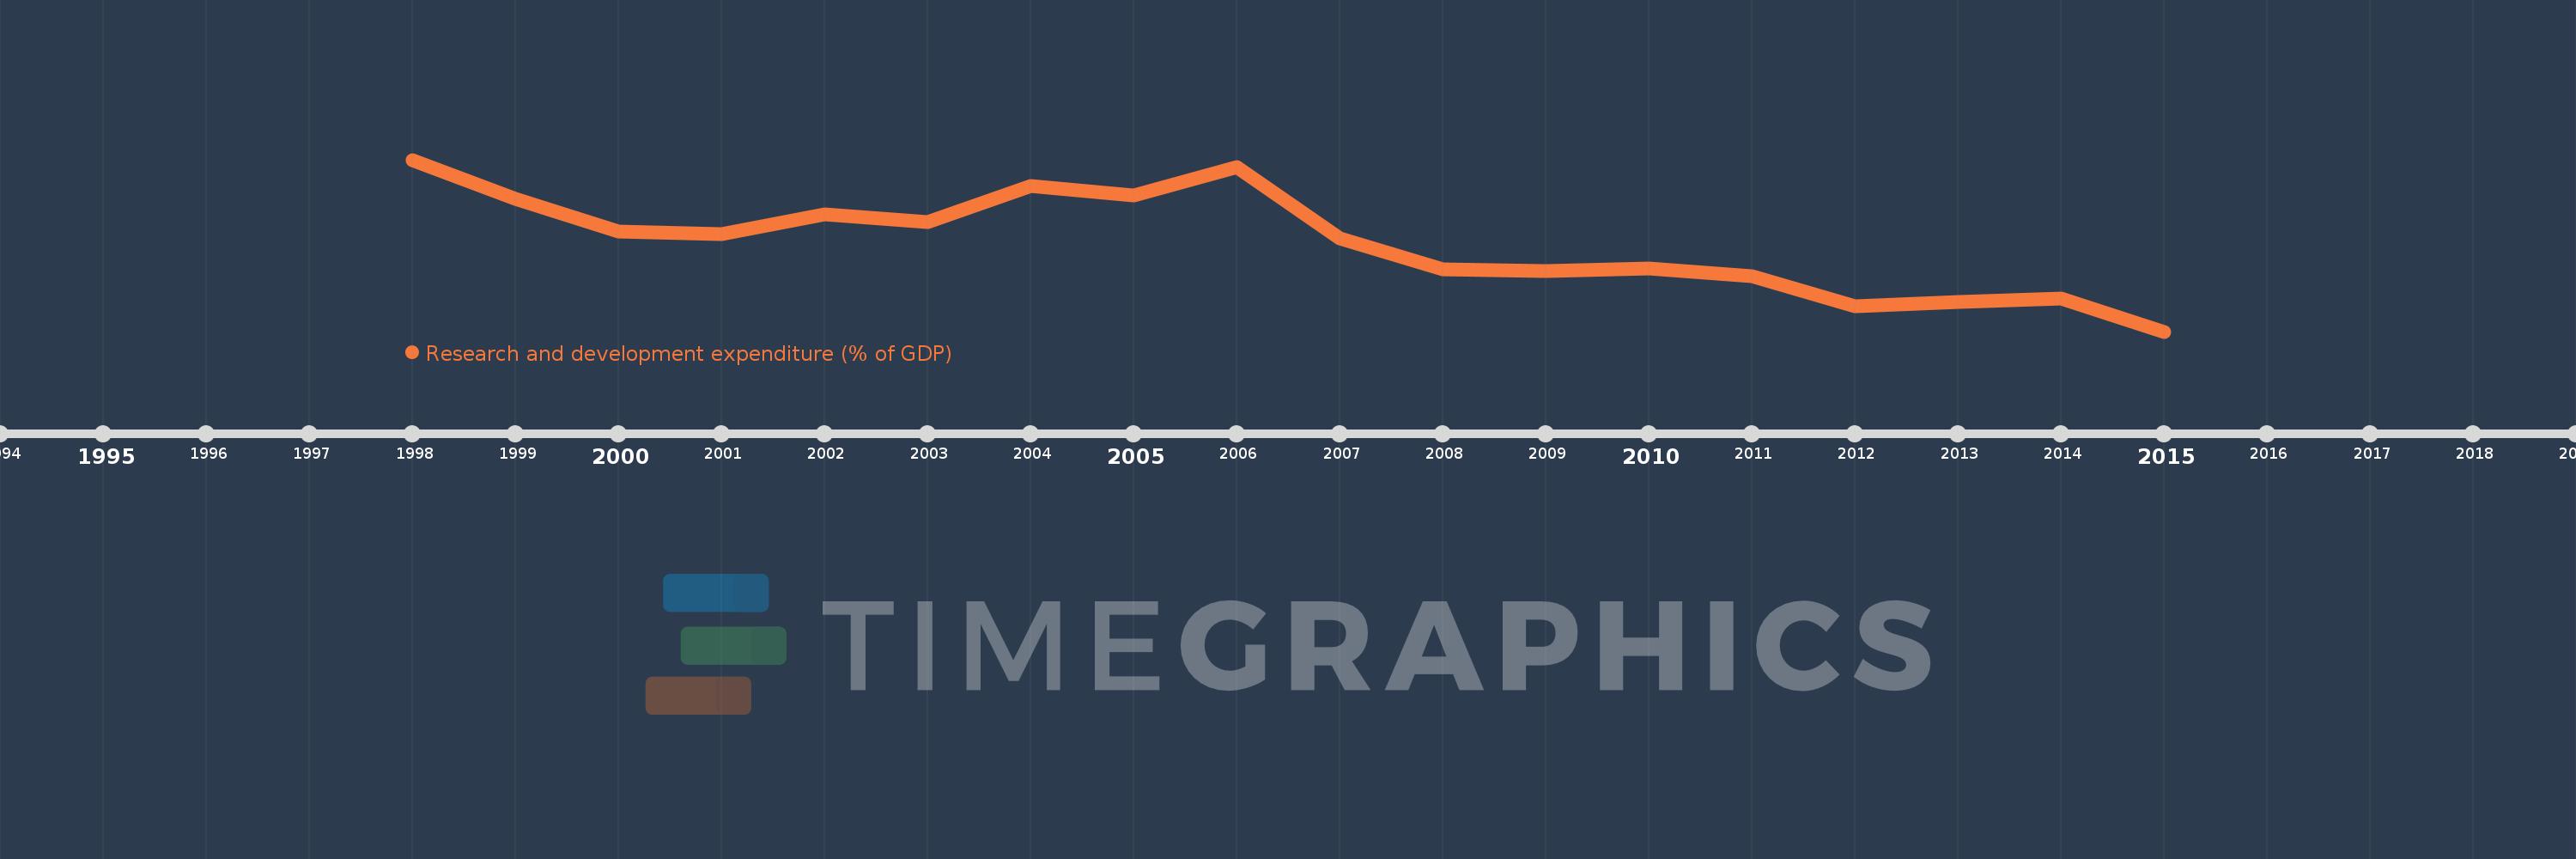
Research and development expenditure (% of GDP)
2015,2014,2013,2012,2011,2010,2009,2008,2007,2006,2005,2004,2003,2002,2001,2000,1999,1998
This statistics in other country:
Timeline:
This timeline shows a graph from 1998 to 2015 of Ukraine. No data until 1997. Number of actual observations by date: 18.
Source name:
World Development Indicators
Source organization:
United Nations Educational, Scientific, and Cultural Organization (UNESCO) Institute for Statistics.
Categories, topics:
Science & Technology
Last updated:
apr 23, 2017
Indicators value changes by year
At the date of observation
Value
Absolute change
Change from previous value
jan 1, 1998
1.192
+1.192
0.0%
jan 1, 1999
1.07
-0.122
-10.26%
jan 1, 2000
0.97
-0.1
-9.37%
jan 1, 2001
0.962
-0.008
-0.78%
jan 1, 2002
1.023
+0.061
6.36%
jan 1, 2003
0.998
-0.025
-2.45%
jan 1, 2004
1.112
+0.114
11.38%
jan 1, 2005
1.082
-0.03
-2.72%
jan 1, 2006
1.169
+0.087
8.08%
jan 1, 2007
0.949
-0.22
-18.81%
jan 1, 2008
0.853
-0.096
-10.1%
jan 1, 2009
0.846
-0.007
-0.79%
jan 1, 2010
0.856
+0.01
1.18%
jan 1, 2011
0.831
-0.025
-2.97%
jan 1, 2012
0.738
-0.093
-11.21%
jan 1, 2013
0.752
+0.014
1.88%
jan 1, 2014
0.762
+0.01
1.34%
jan 1, 2015
0.659
-0.103
-13.53%
Ranking of countries by current statistics by years


Comments: