29
/
en
AIzaSyAYiBZKx7MnpbEhh9jyipgxe19OcubqV5w
April 1, 2024
221517
Paraguay
PRY
true
2
1
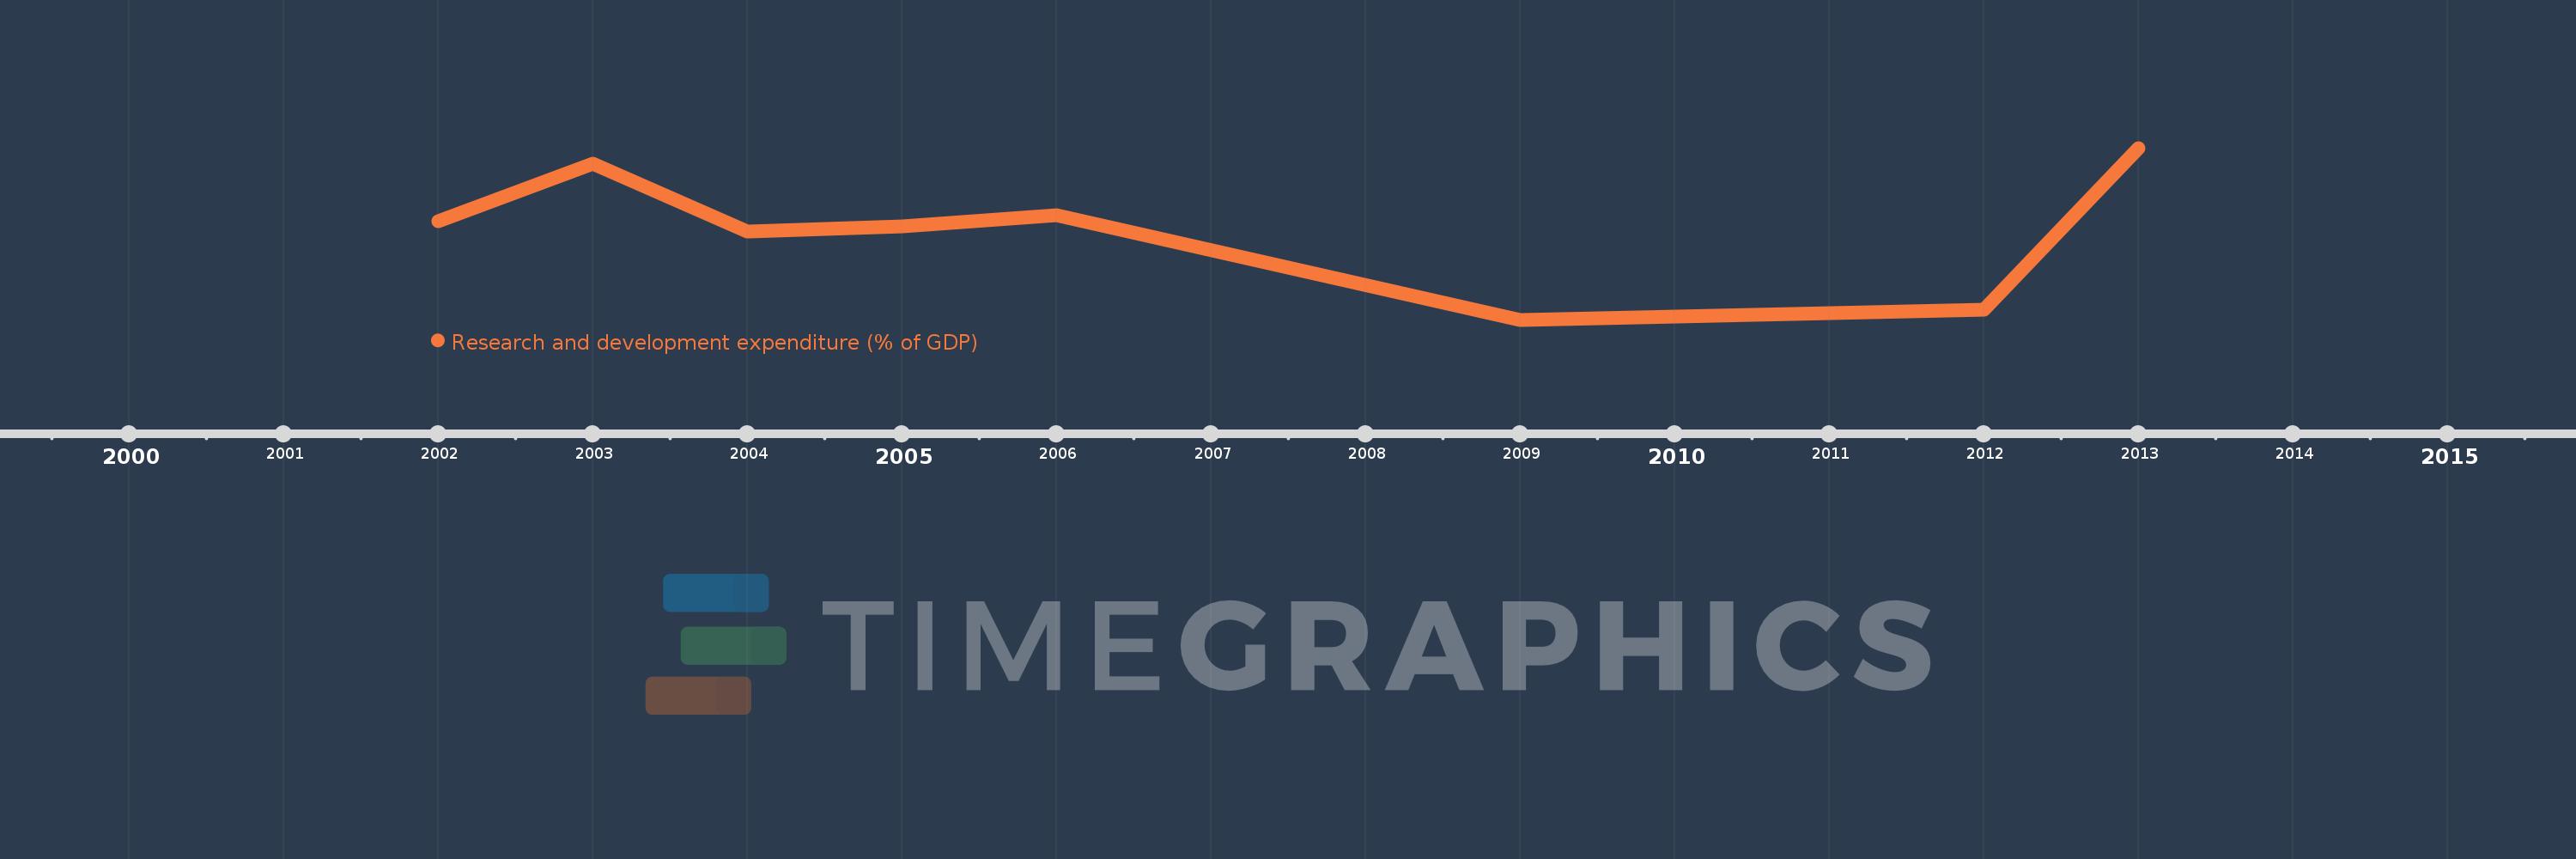
Research and development expenditure (% of GDP)
2013,2012,2009,2006,2005,2004,2003,2002
This statistics in other country:
Timeline:
This timeline shows a graph from 2002 to 2013 of Paraguay. No data until 2001. Number of actual observations by date: 8.
Source name:
World Development Indicators
Source organization:
United Nations Educational, Scientific, and Cultural Organization (UNESCO) Institute for Statistics.
Categories, topics:
Science & Technology
Last updated:
apr 23, 2017
Indicators value changes by year
At the date of observation
Value
Absolute change
Change from previous value
jan 1, 2002
0.074
+0.074
0.0%
jan 1, 2003
0.085
+0.011
14.78%
jan 1, 2004
0.072
-0.014
-15.98%
jan 1, 2005
0.073
+0.001
1.44%
jan 1, 2006
0.075
+0.002
3.04%
jan 1, 2009
0.055
-0.02
-26.91%
jan 1, 2012
0.057
+0.002
3.64%
jan 1, 2013
0.088
+0.031
55.46%
Ranking of countries by current statistics by years


Comments: