30
/pt/
AIzaSyAYiBZKx7MnpbEhh9jyipgxe19OcubqV5w
April 1, 2024
74348
Austria
AUT
true
2
1
Research and development expenditure (% of GDP)
2015,2014,2013,2012,2011,2010,2009,2008,2007,2006,2005,2004,2003,2002,2001,2000,1999,1998,1997
Download
Biblioteca de estatísticas globais →Austria →

Research and development expenditure (% of GDP)

Estas estatísticas em outros países:

AlbaniaAlgeriaArgentinaArmeniaAustraliaAustriaAzerbaijanBahrainBelarusBelgiumBermudaBoliviaBosnia and HerzegovinaBotswanaBrazilBrunei DarussalamBulgariaBurkina FasoBurundiCabo VerdeCambodiaCanadaCentral Europe and the BalticsChileChinaColombiaCongo, Dem. Rep.Costa RicaCroatiaCubaCyprusCzech RepublicDenmarkEarly-demographic dividendEast Asia & PacificEast Asia & Pacific (excluding high income)East Asia & Pacific (IDA & IBRD countries)EcuadorEgypt, Arab Rep.El SalvadorEstoniaEthiopiaEuro areaEurope & Central AsiaEurope & Central Asia (excluding high income)Europe & Central Asia (IDA & IBRD countries)European UnionFaroe IslandsFinlandFranceGabonGambia, TheGeorgiaGermanyGhanaGreeceGreenlandGuatemalaHigh incomeHondurasHong Kong SAR, ChinaHungaryIBRD onlyIcelandIDA & IBRD totalIndiaIndonesiaIran, Islamic Rep.IraqIrelandIsraelItalyJamaicaJapanJordanKazakhstanKenyaKorea, Rep.KuwaitKyrgyz RepublicLao PDRLate-demographic dividendLatin America & Caribbean Latin America & Caribbean (excluding high income)Latin America & the Caribbean (IDA & IBRD countries)LatviaLesothoLithuaniaLow & middle incomeLower middle incomeLuxembourgMacao SAR, ChinaMacedonia, FYRMadagascarMalaysiaMaliMaltaMauritiusMexicoMiddle East & North Africa (excluding high income)Middle East & North Africa (IDA & IBRD countries)Middle incomeMoldovaMonacoMongoliaMontenegroMoroccoMozambiqueMyanmarNamibiaNepalNetherlandsNew ZealandNicaraguaNigeriaNorth AmericaNorwayOECD membersOmanPakistanPanamaParaguayPeruPhilippinesPolandPortugalPost-demographic dividendPuerto RicoQatarRomaniaRussian FederationSaudi ArabiaSenegalSerbiaSeychellesSingaporeSlovak RepublicSloveniaSouth AfricaSouth AsiaSouth Asia (IDA & IBRD)SpainSri LankaSt. LuciaSt. Vincent and the GrenadinesSub-Saharan Africa Sub-Saharan Africa (excluding high income)Sub-Saharan Africa (IDA & IBRD countries)SudanSwedenSwitzerlandTajikistanTanzaniaThailandTogoTrinidad and TobagoTunisiaTurkeyUgandaUkraineUnited Arab EmiratesUnited KingdomUnited StatesUpper middle incomeUruguayUzbekistanVietnamWorldZambia

Linha do tempo:

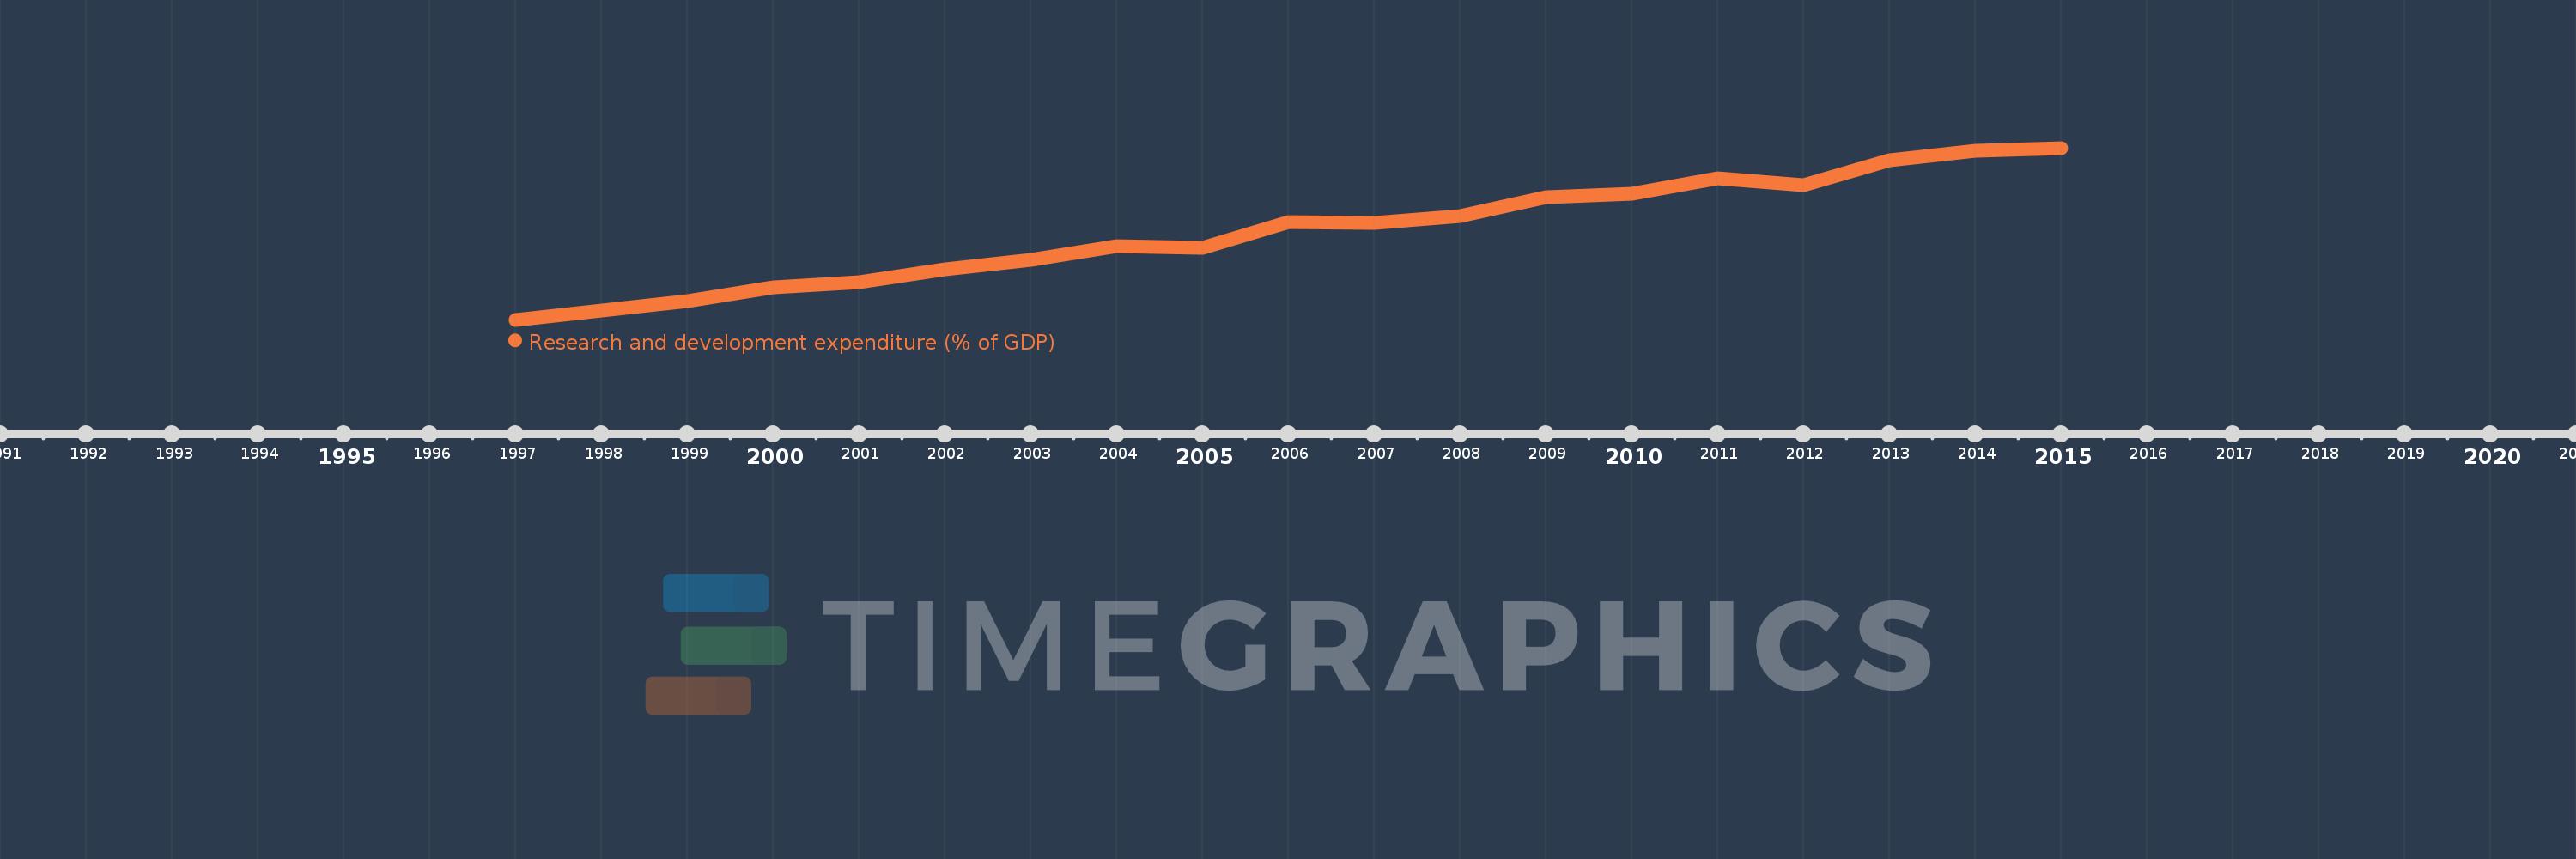
Nesta escala de tempo está apresentado um gráfico de 1997 ano até 2015 ano Austria. Dados de 1996 ano ausente. O número de observações reais por data: 19.

Fonte (nome):

Indicadores de desenvolvimento mundial

Fonte (organização):

United Nations Educational, Scientific, and Cultural Organization (UNESCO) Institute for Statistics.

Categorias:

Science & Technology

Foi atualizado:

23 abr 2017 ano

Indicadores de alterações dos valores ao longo dos anos

Em média:
2.304
Mínimo:
1.584
1 jan 1997 ano
Máximo:
2.986
1 jan 2015 ano
Na data de observação
Valor
Mudança absoluta
A alteração em relação ao valor anterior
1 jan 1997 ano
1.584
+1.584
0.0%
1 jan 1998 ano
1.659
+0.074
4.69%
1 jan 1999 ano
1.736
+0.078
4.68%
1 jan 2000 ano
1.849
+0.113
6.52%
1 jan 2001 ano
1.89
+0.04
2.18%
1 jan 2002 ano
1.996
+0.106
5.63%
1 jan 2003 ano
2.07
+0.074
3.7%
1 jan 2004 ano
2.183
+0.113
5.45%
1 jan 2005 ano
2.174
-0.009
-0.41%
1 jan 2006 ano
2.383
+0.21
9.64%
1 jan 2007 ano
2.371
-0.012
-0.51%
1 jan 2008 ano
2.432
+0.061
2.58%
1 jan 2009 ano
2.586
+0.153
6.3%
1 jan 2010 ano
2.614
+0.028
1.08%
1 jan 2011 ano
2.738
+0.124
4.75%
1 jan 2012 ano
2.682
-0.056
-2.05%
1 jan 2013 ano
2.886
+0.204
7.61%
1 jan 2014 ano
2.964
+0.079
2.73%
1 jan 2015 ano
2.986
+0.022
0.73%

Classificação de países por estatísticas atuais por anos