30
/pt/
AIzaSyAYiBZKx7MnpbEhh9jyipgxe19OcubqV5w
April 1, 2024
116209
Cuba
CUB
true
2
1
Research and development expenditure (% of GDP)
2015,2014,2013,2012,2011,2010,2009,2008,2007,2006,2005,2004,2003,2002,2001,2000,1999,1998,1997
Download
Biblioteca de estatísticas globais →Cuba →

Research and development expenditure (% of GDP)

Estas estatísticas em outros países:

AlbaniaAlgeriaArgentinaArmeniaAustraliaAustriaAzerbaijanBahrainBelarusBelgiumBermudaBoliviaBosnia and HerzegovinaBotswanaBrazilBrunei DarussalamBulgariaBurkina FasoBurundiCabo VerdeCambodiaCanadaCentral Europe and the BalticsChileChinaColombiaCongo, Dem. Rep.Costa RicaCroatiaCubaCyprusCzech RepublicDenmarkEarly-demographic dividendEast Asia & PacificEast Asia & Pacific (excluding high income)East Asia & Pacific (IDA & IBRD countries)EcuadorEgypt, Arab Rep.El SalvadorEstoniaEthiopiaEuro areaEurope & Central AsiaEurope & Central Asia (excluding high income)Europe & Central Asia (IDA & IBRD countries)European UnionFaroe IslandsFinlandFranceGabonGambia, TheGeorgiaGermanyGhanaGreeceGreenlandGuatemalaHigh incomeHondurasHong Kong SAR, ChinaHungaryIBRD onlyIcelandIDA & IBRD totalIndiaIndonesiaIran, Islamic Rep.IraqIrelandIsraelItalyJamaicaJapanJordanKazakhstanKenyaKorea, Rep.KuwaitKyrgyz RepublicLao PDRLate-demographic dividendLatin America & Caribbean Latin America & Caribbean (excluding high income)Latin America & the Caribbean (IDA & IBRD countries)LatviaLesothoLithuaniaLow & middle incomeLower middle incomeLuxembourgMacao SAR, ChinaMacedonia, FYRMadagascarMalaysiaMaliMaltaMauritiusMexicoMiddle East & North Africa (excluding high income)Middle East & North Africa (IDA & IBRD countries)Middle incomeMoldovaMonacoMongoliaMontenegroMoroccoMozambiqueMyanmarNamibiaNepalNetherlandsNew ZealandNicaraguaNigeriaNorth AmericaNorwayOECD membersOmanPakistanPanamaParaguayPeruPhilippinesPolandPortugalPost-demographic dividendPuerto RicoQatarRomaniaRussian FederationSaudi ArabiaSenegalSerbiaSeychellesSingaporeSlovak RepublicSloveniaSouth AfricaSouth AsiaSouth Asia (IDA & IBRD)SpainSri LankaSt. LuciaSt. Vincent and the GrenadinesSub-Saharan Africa Sub-Saharan Africa (excluding high income)Sub-Saharan Africa (IDA & IBRD countries)SudanSwedenSwitzerlandTajikistanTanzaniaThailandTogoTrinidad and TobagoTunisiaTurkeyUgandaUkraineUnited Arab EmiratesUnited KingdomUnited StatesUpper middle incomeUruguayUzbekistanVietnamWorldZambia

Linha do tempo:

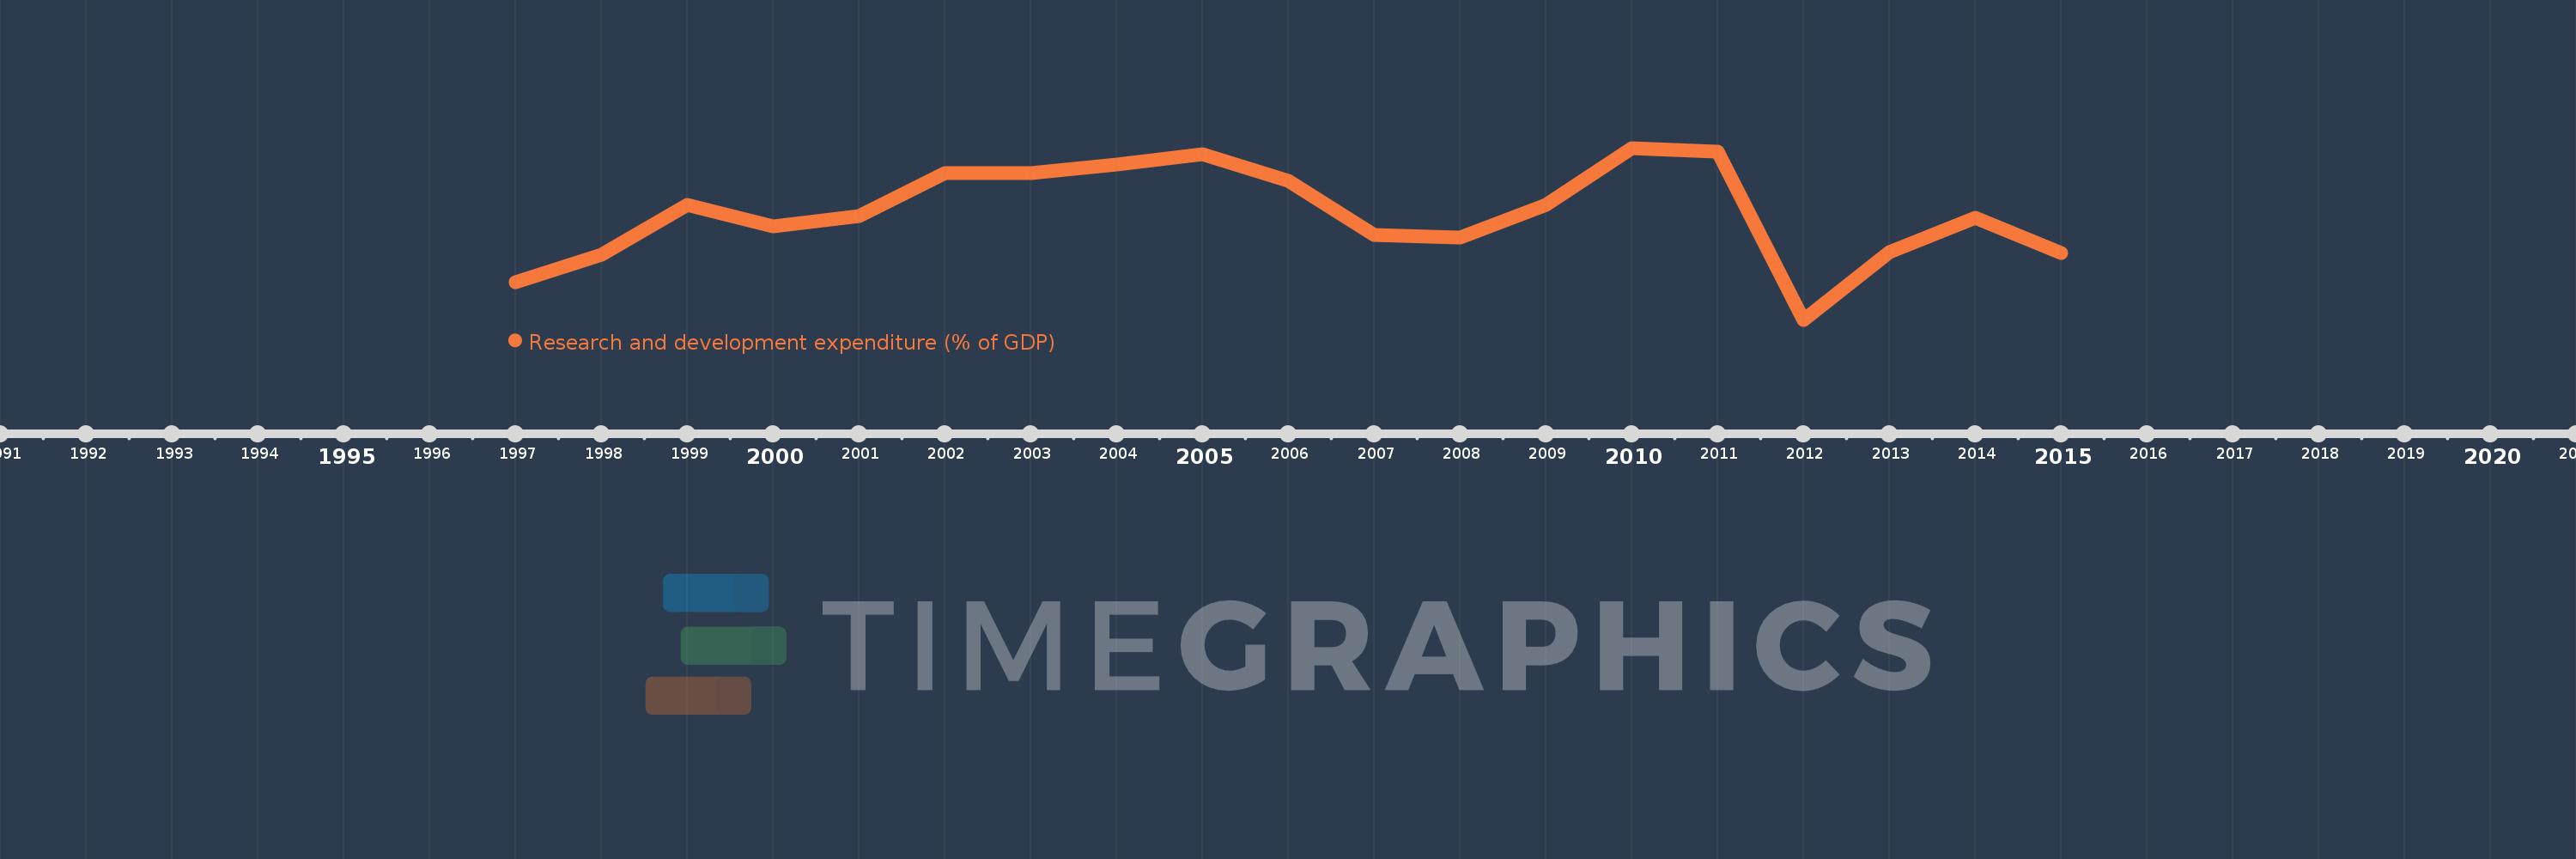
Nesta escala de tempo está apresentado um gráfico de 1997 ano até 2015 ano Cuba. Dados de 1996 ano ausente. O número de observações reais por data: 19.

Fonte (nome):

Indicadores de desenvolvimento mundial

Fonte (organização):

United Nations Educational, Scientific, and Cultural Organization (UNESCO) Institute for Statistics.

Categorias:

Science & Technology

Foi atualizado:

23 abr 2017 ano

Indicadores de alterações dos valores ao longo dos anos

Em média:
0.485
Mínimo:
0.272
1 jan 2012 ano
Máximo:
0.615
1 jan 2010 ano
Na data de observação
Valor
Mudança absoluta
A alteração em relação ao valor anterior
1 jan 1997 ano
0.347
+0.347
0.0%
1 jan 1998 ano
0.402
+0.054
15.65%
1 jan 1999 ano
0.501
+0.1
24.77%
1 jan 2000 ano
0.458
-0.043
-8.56%
1 jan 2001 ano
0.479
+0.02
4.44%
1 jan 2002 ano
0.565
+0.087
18.1%
1 jan 2003 ano
0.564
-0.001
-0.15%
1 jan 2004 ano
0.582
+0.018
3.19%
1 jan 2005 ano
0.602
+0.02
3.41%
1 jan 2006 ano
0.549
-0.053
-8.82%
1 jan 2007 ano
0.441
-0.108
-19.63%
1 jan 2008 ano
0.436
-0.005
-1.19%
1 jan 2009 ano
0.501
+0.064
14.78%
1 jan 2010 ano
0.615
+0.114
22.82%
1 jan 2011 ano
0.608
-0.007
-1.17%
1 jan 2012 ano
0.272
-0.336
-55.25%
1 jan 2013 ano
0.407
+0.135
49.74%
1 jan 2014 ano
0.475
+0.067
16.58%
1 jan 2015 ano
0.405
-0.069
-14.61%

Classificação de países por estatísticas atuais por anos