29
/pt/
pt
AIzaSyAYiBZKx7MnpbEhh9jyipgxe19OcubqV5w
April 1, 2024
52211
North America
NAC
false
2
1
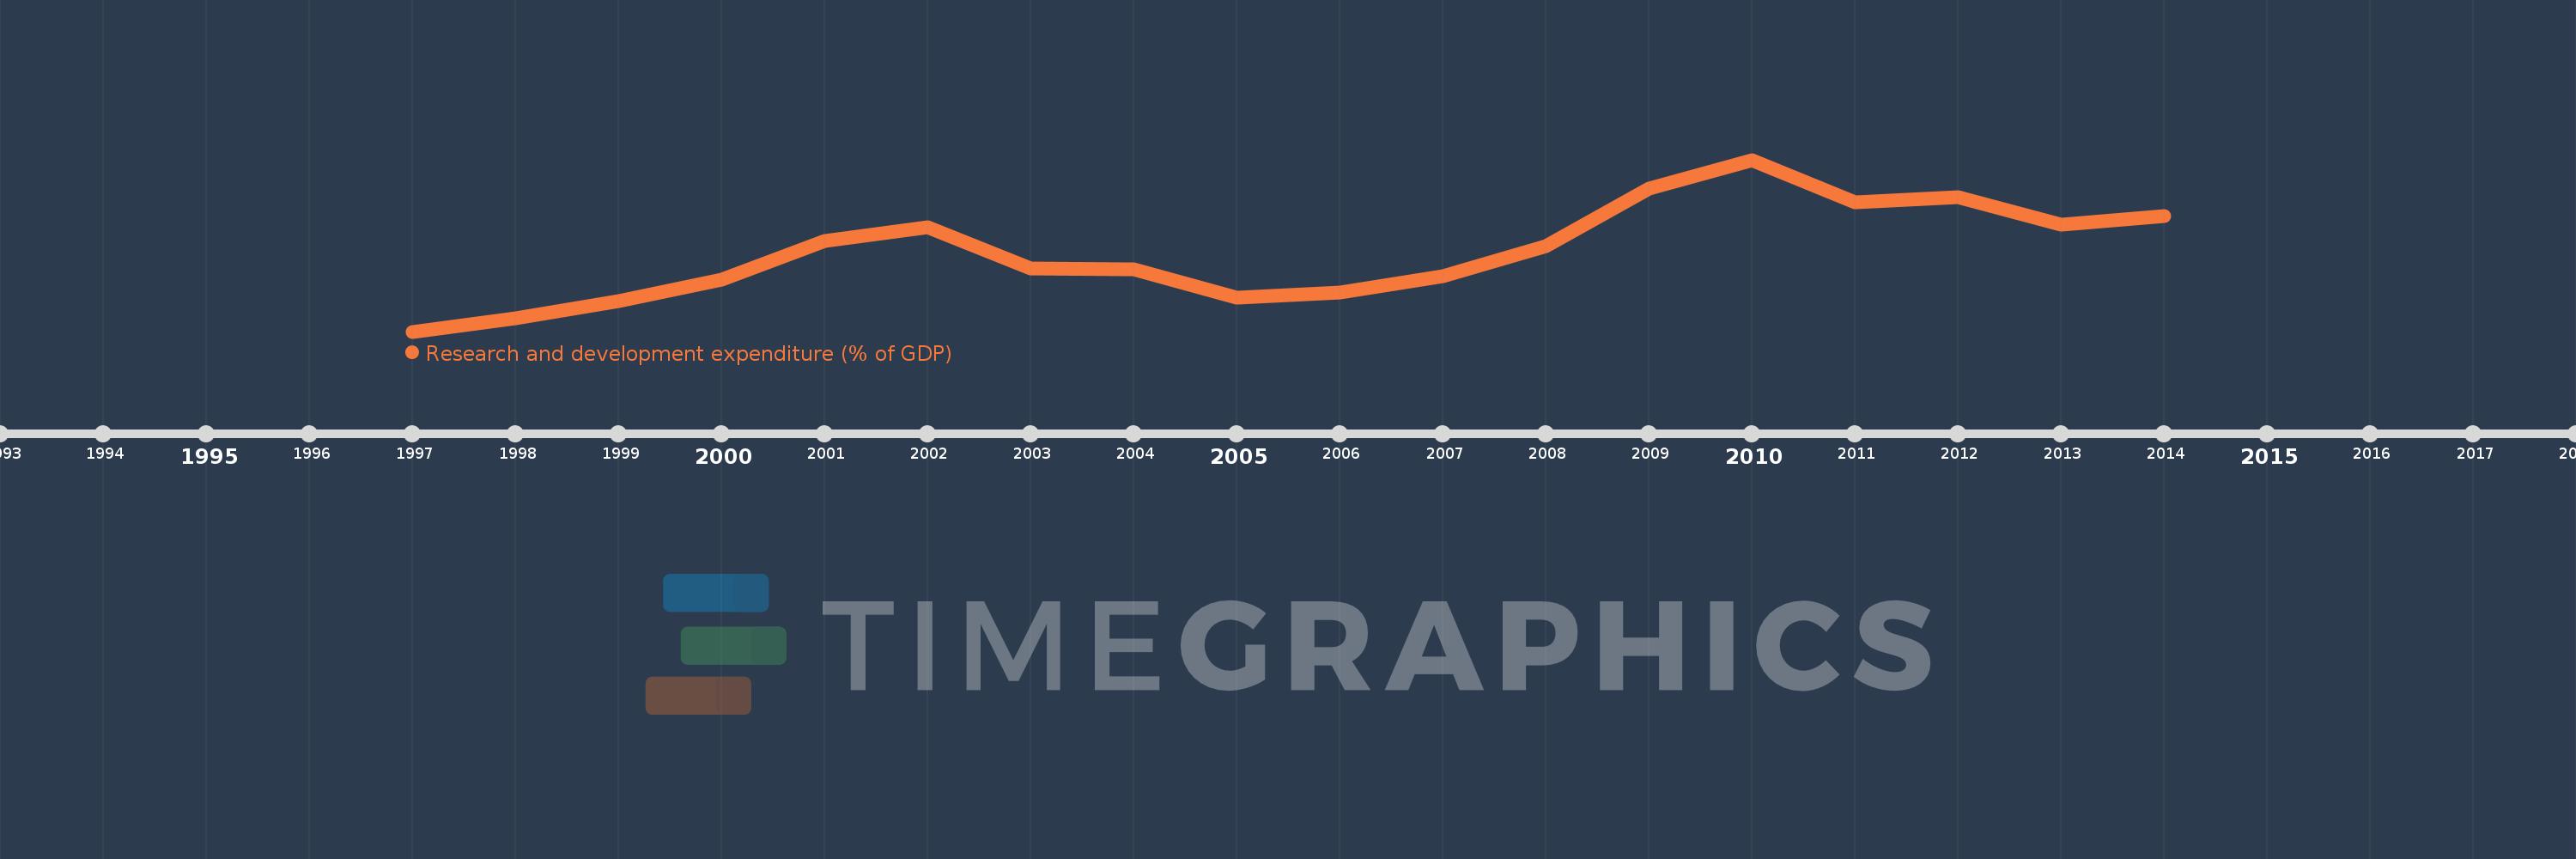
Research and development expenditure (% of GDP)
2014,2013,2012,2011,2010,2009,2008,2007,2006,2005,2004,2003,2002,2001,2000,1999,1998,1997
Estas estatísticas em outros países:
Linha do tempo:
Nesta escala de tempo está apresentado um gráfico de 1997 ano até 2014 ano North America. Dados de 1996 ano ausente. O número de observações reais por data: 18.
Fonte (nome):
Indicadores de desenvolvimento mundial
Fonte (organização):
United Nations Educational, Scientific, and Cultural Organization (UNESCO) Institute for Statistics.
Categorias:
Science & Technology
Foi atualizado:
23 abr 2017 ano
Indicadores de alterações dos valores ao longo dos anos
Mínimo:
2.382
1 jan 1997 ano
Máximo:
2.74
1 jan 2010 ano
Na data de observação
Valor
Mudança absoluta
A alteração em relação ao valor anterior
1 jan 1997 ano
2.382
+2.382
0.0%
1 jan 1998 ano
2.41
+0.028
1.18%
1 jan 1999 ano
2.446
+0.036
1.48%
1 jan 2000 ano
2.491
+0.045
1.82%
1 jan 2001 ano
2.57
+0.079
3.19%
1 jan 2002 ano
2.599
+0.029
1.14%
1 jan 2003 ano
2.514
-0.086
-3.3%
1 jan 2004 ano
2.512
-0.002
-0.07%
1 jan 2005 ano
2.453
-0.059
-2.34%
1 jan 2006 ano
2.463
+0.01
0.41%
1 jan 2007 ano
2.498
+0.035
1.42%
1 jan 2008 ano
2.561
+0.062
2.5%
1 jan 2009 ano
2.68
+0.119
4.66%
1 jan 2010 ano
2.74
+0.06
2.22%
1 jan 2011 ano
2.652
-0.088
-3.22%
1 jan 2012 ano
2.662
+0.011
0.4%
1 jan 2013 ano
2.605
-0.058
-2.17%
1 jan 2014 ano
2.622
+0.017
0.65%
Classificação de países por estatísticas atuais por anos


Comentários: