29
/fr/
fr
AIzaSyAYiBZKx7MnpbEhh9jyipgxe19OcubqV5w
April 1, 2024
52211
North America
NAC
false
2
1
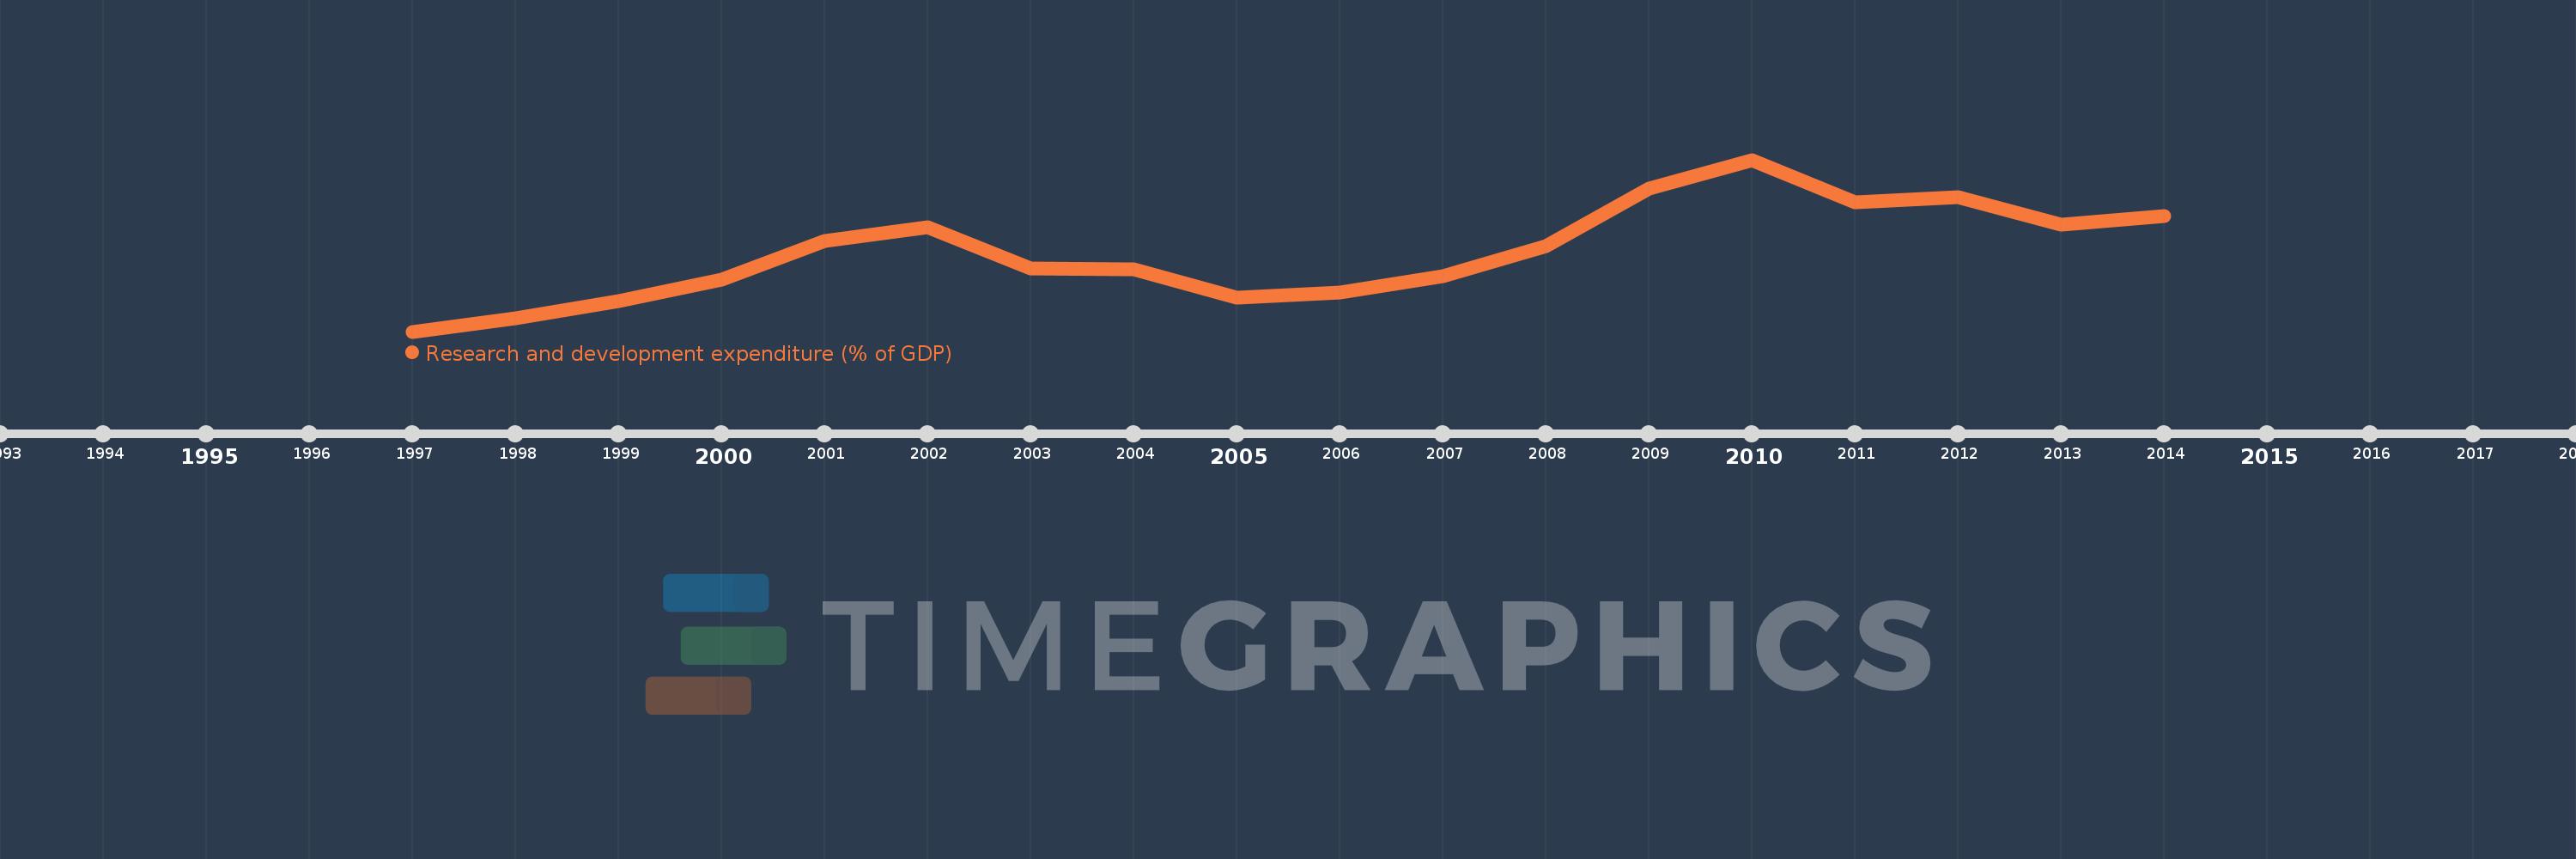
Research and development expenditure (% of GDP)
2014,2013,2012,2011,2010,2009,2008,2007,2006,2005,2004,2003,2002,2001,2000,1999,1998,1997
Cette statistique dans les autres pays:
La ligne de temps
Cette échelle de temps montre un graphique de 1997 année à 2014 année North America. Les données jusqu'à 1996 année ne sont pas présentés. Quantité d'observations actuelles selon dates: 18.
Source (désignation):
Les indicateurs du développement mondiale
Source (organisation):
United Nations Educational, Scientific, and Cultural Organization (UNESCO) Institute for Statistics.
Catégories:
Science & Technology
Dernière mise à jour
23 avr. 2017
Les indicateurs de changement de valeurs selon les années
Minimum:
2.382
1 janv. 1997
Pour la date d''observation
Valeur
Changement absolu
Le changement par rapport à la valeur précédente
1 janv. 1997
2.382
+2.382
0.0%
1 janv. 1998
2.41
+0.028
1.18%
1 janv. 1999
2.446
+0.036
1.48%
1 janv. 2000
2.491
+0.045
1.82%
1 janv. 2001
2.57
+0.079
3.19%
1 janv. 2002
2.599
+0.029
1.14%
1 janv. 2003
2.514
-0.086
-3.3%
1 janv. 2004
2.512
-0.002
-0.07%
1 janv. 2005
2.453
-0.059
-2.34%
1 janv. 2006
2.463
+0.01
0.41%
1 janv. 2007
2.498
+0.035
1.42%
1 janv. 2008
2.561
+0.062
2.5%
1 janv. 2009
2.68
+0.119
4.66%
1 janv. 2010
2.74
+0.06
2.22%
1 janv. 2011
2.652
-0.088
-3.22%
1 janv. 2012
2.662
+0.011
0.4%
1 janv. 2013
2.605
-0.058
-2.17%
1 janv. 2014
2.622
+0.017
0.65%
Classement des pays selon les statistiques actuelles par années


Commentaires: