29
/fr/
fr
AIzaSyAYiBZKx7MnpbEhh9jyipgxe19OcubqV5w
April 1, 2024
170450
Korea, Rep.
KOR
true
2
1
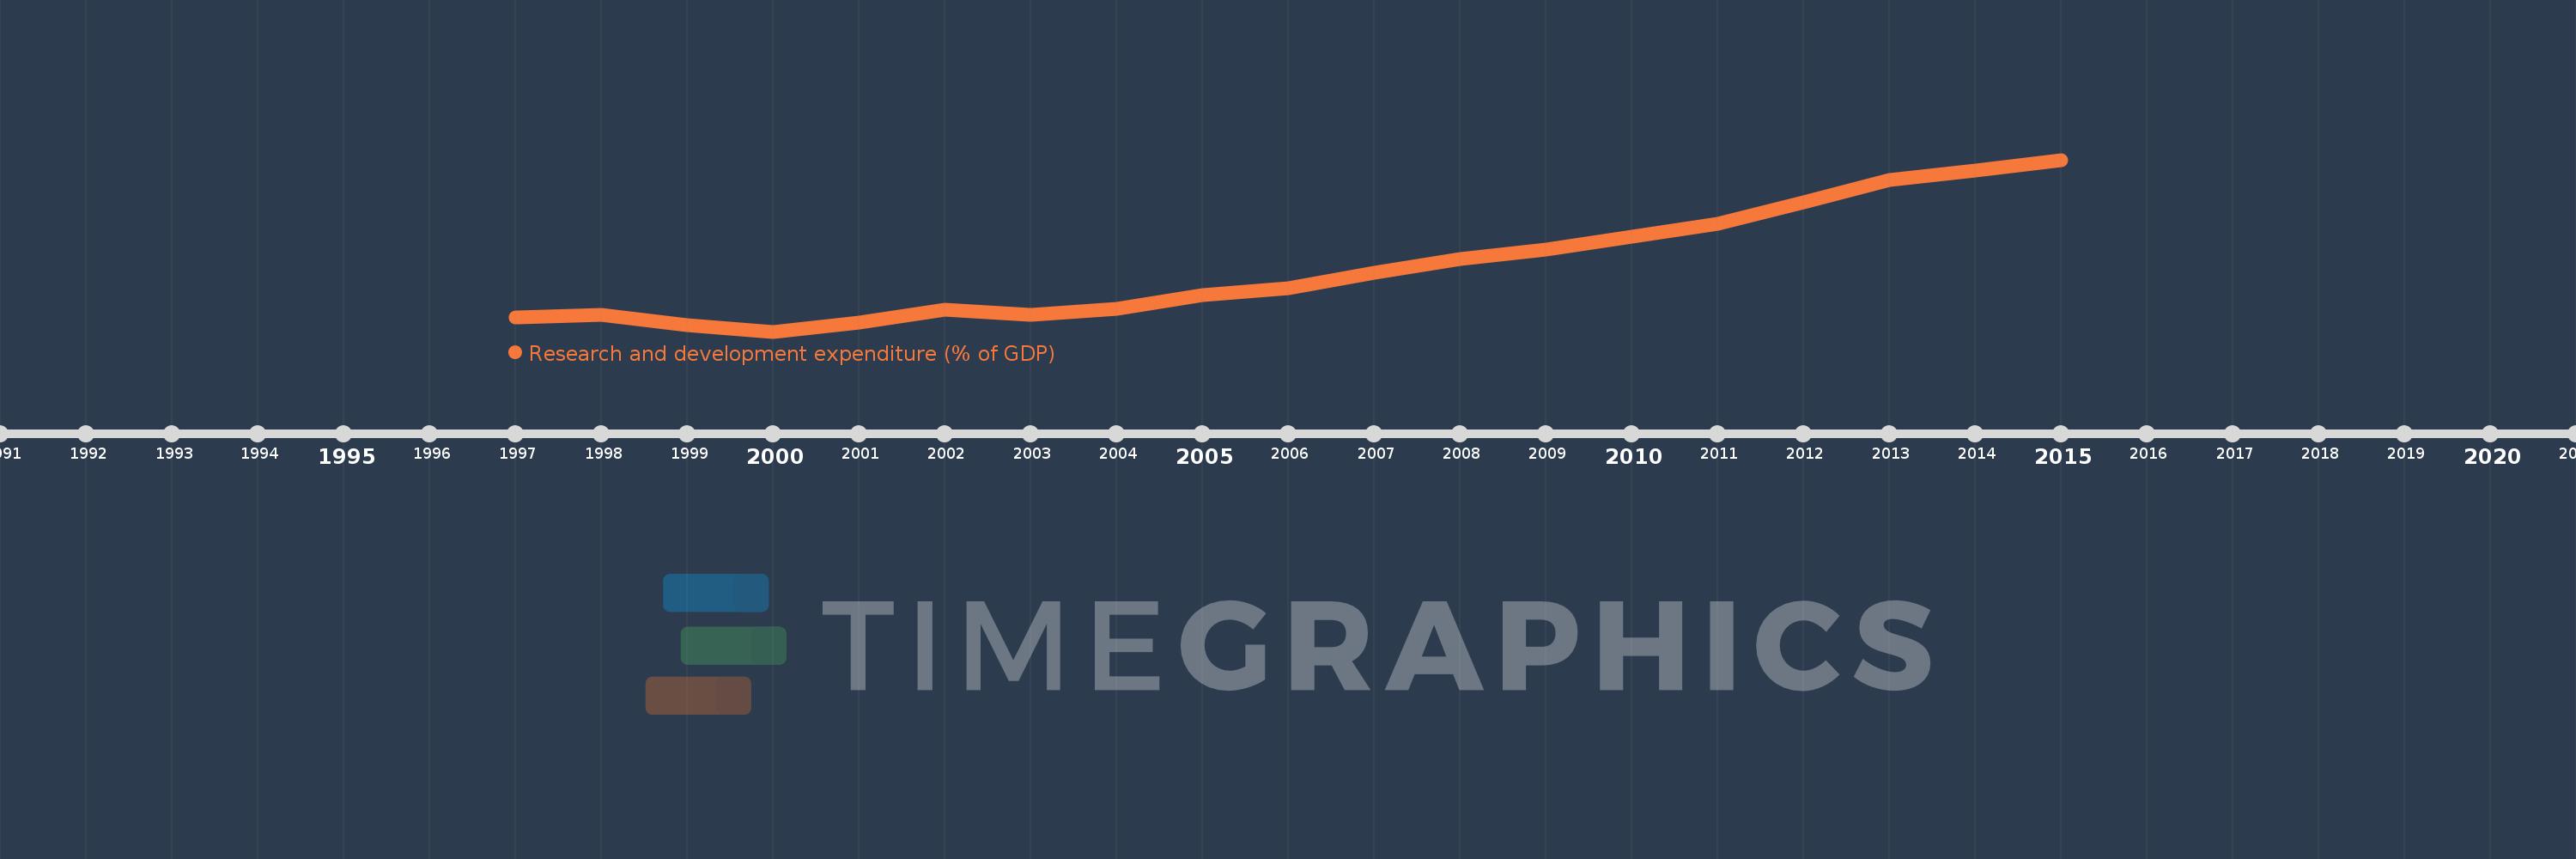
Research and development expenditure (% of GDP)
2015,2014,2013,2012,2011,2010,2009,2008,2007,2006,2005,2004,2003,2002,2001,2000,1999,1998,1997
Cette statistique dans les autres pays:
La ligne de temps
Cette échelle de temps montre un graphique de 1997 année à 2015 année Korea, Rep.. Les données jusqu'à 1996 année ne sont pas présentés. Quantité d'observations actuelles selon dates: 19.
Source (désignation):
Les indicateurs du développement mondiale
Source (organisation):
United Nations Educational, Scientific, and Cultural Organization (UNESCO) Institute for Statistics.
Catégories:
Science & Technology
Dernière mise à jour
23 avr. 2017
Les indicateurs de changement de valeurs selon les années
Minimum:
2.062
1 janv. 2000
Maximum:
4.292
1 janv. 2015
Pour la date d''observation
Valeur
Changement absolu
Le changement par rapport à la valeur précédente
1 janv. 1997
2.241
+2.241
0.0%
1 janv. 1998
2.285
+0.045
1.99%
1 janv. 1999
2.149
-0.137
-5.99%
1 janv. 2000
2.062
-0.087
-4.03%
1 janv. 2001
2.18
+0.118
5.73%
1 janv. 2002
2.341
+0.161
7.38%
1 janv. 2003
2.274
-0.067
-2.87%
1 janv. 2004
2.352
+0.078
3.42%
1 janv. 2005
2.532
+0.181
7.7%
1 janv. 2006
2.626
+0.094
3.7%
1 janv. 2007
2.831
+0.204
7.79%
1 janv. 2008
3.0
+0.17
5.99%
1 janv. 2009
3.123
+0.123
4.1%
1 janv. 2010
3.293
+0.17
5.44%
1 janv. 2011
3.466
+0.173
5.24%
1 janv. 2012
3.744
+0.278
8.01%
1 janv. 2013
4.026
+0.282
7.53%
1 janv. 2014
4.149
+0.123
3.06%
1 janv. 2015
4.292
+0.143
3.45%
Classement des pays selon les statistiques actuelles par années


Commentaires: