29
/
en
AIzaSyAYiBZKx7MnpbEhh9jyipgxe19OcubqV5w
April 1, 2024
44107
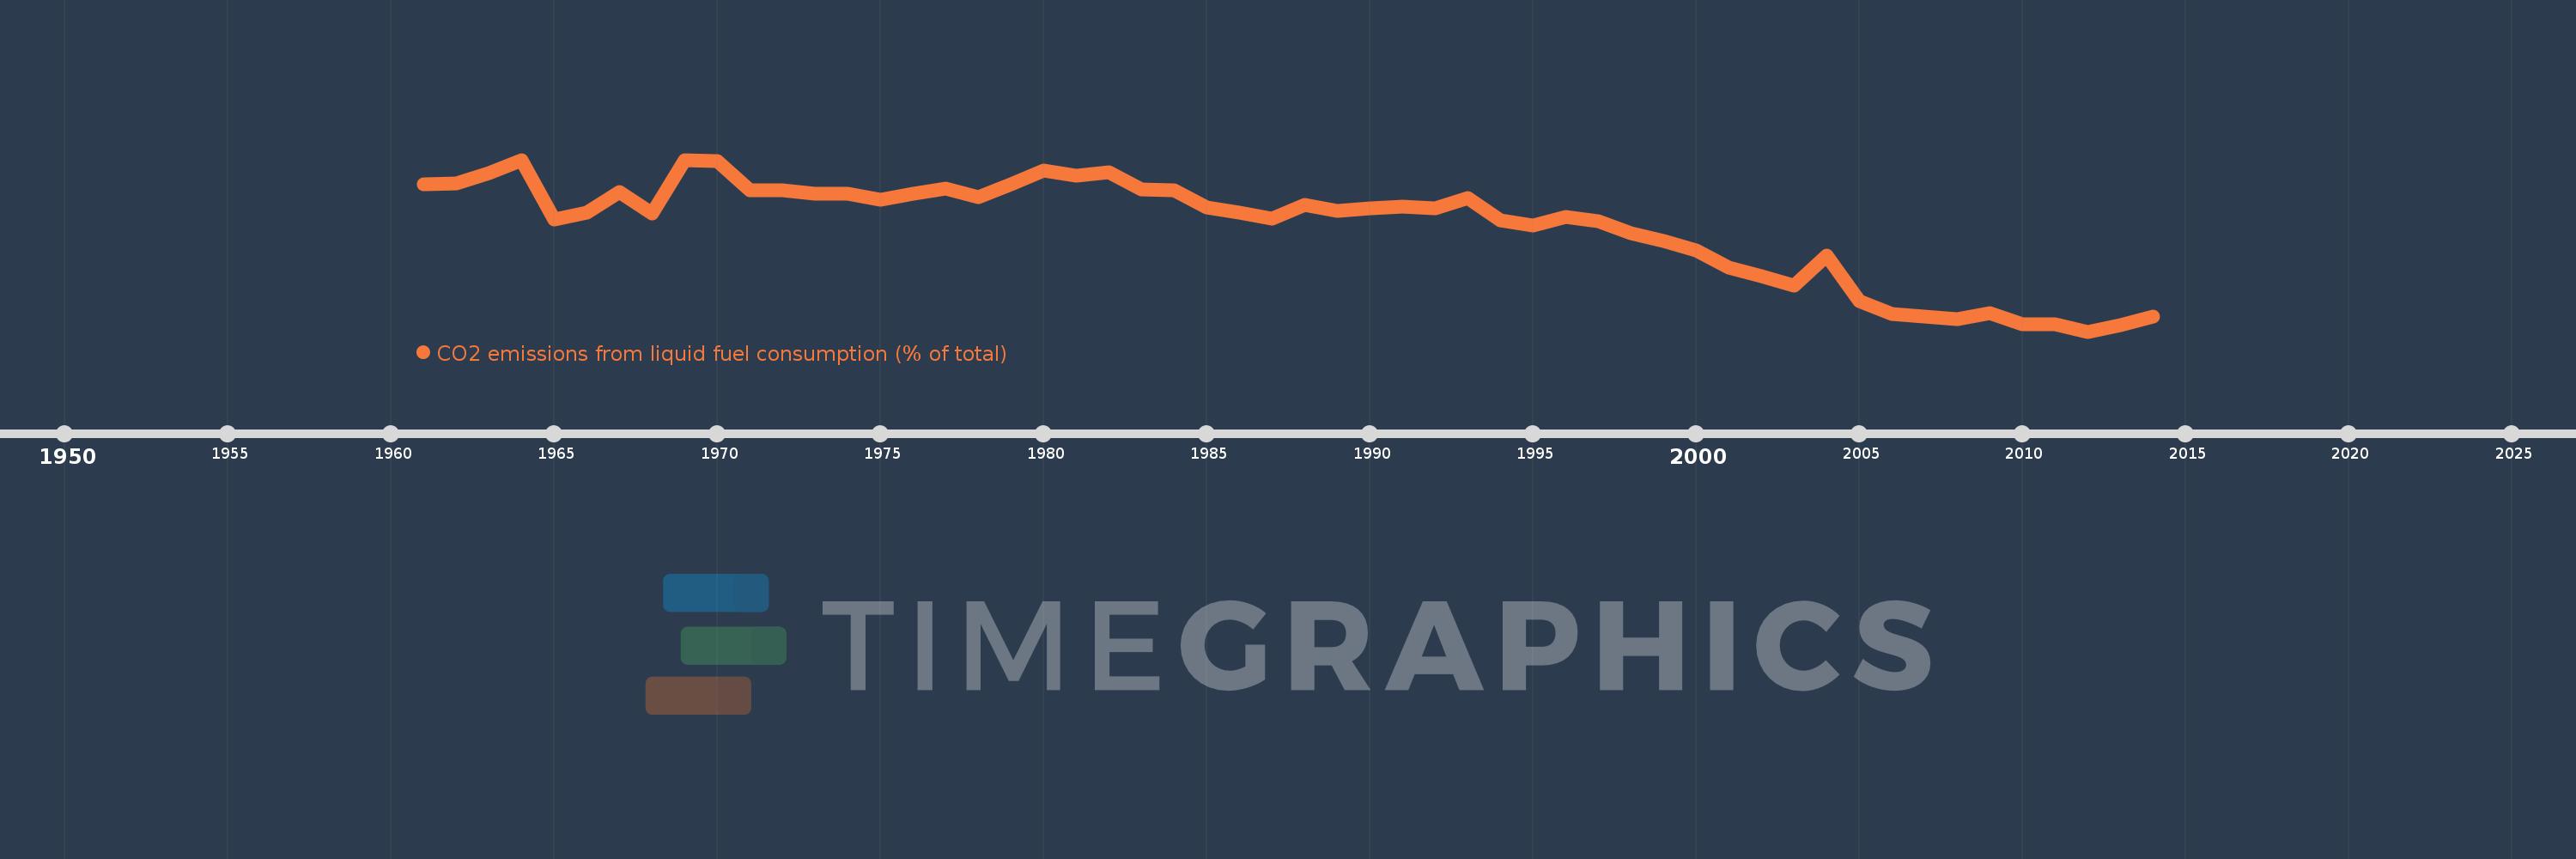
Least developed countries: UN classification
LDC
false
2
1
CO2 emissions from liquid fuel consumption (% of total)
2014,2013,2012,2011,2010,2009,2008,2007,2006,2005,2004,2003,2002,2001,2000,1999,1998,1997,1996,1995,1994,1993,1992,1991,1990,1989,1988,1987,1986,1985,1984,1983,1982,1981,1980,1979,1978,1977,1976,1975,1974,1973,1972,1971,1970,1969,1968,1967,1966,1965,1964,1963,1962,1961
This statistics in other country:
AfghanistanAlbaniaAlgeriaAndorraAngolaAntigua and BarbudaArab WorldArgentinaArmeniaArubaAustraliaAustriaAzerbaijanBahamas, TheBahrainBangladeshBarbadosBelarusBelgiumBelizeBeninBermudaBhutanBoliviaBosnia and HerzegovinaBotswanaBrazilBritish Virgin IslandsBrunei DarussalamBulgariaBurkina FasoBurundiCabo VerdeCambodiaCameroonCanadaCaribbean small statesCayman IslandsCentral African RepublicCentral Europe and the BalticsChadChileChinaColombiaComorosCongo, Dem. Rep.Congo, Rep.Costa RicaCote d'IvoireCroatiaCubaCuracaoCyprusCzech RepublicDenmarkDjiboutiDominicaDominican RepublicEarly-demographic dividendEast Asia & PacificEast Asia & Pacific (excluding high income)East Asia & Pacific (IDA & IBRD countries)EcuadorEgypt, Arab Rep.El SalvadorEquatorial GuineaEritreaEstoniaEthiopiaEuro areaEurope & Central AsiaEurope & Central Asia (excluding high income)Europe & Central Asia (IDA & IBRD countries)European UnionFaroe IslandsFijiFinlandFragile and conflict affected situationsFranceFrench PolynesiaGabonGambia, TheGeorgiaGermanyGhanaGibraltarGreeceGreenlandGrenadaGuatemalaGuineaGuinea-BissauGuyanaHaitiHeavily indebted poor countries (HIPC)High incomeHondurasHong Kong SAR, ChinaHungaryIBRD onlyIcelandIDA & IBRD totalIDA blendIDA onlyIDA totalIndiaIndonesiaIran, Islamic Rep.IraqIrelandIsraelItalyJamaicaJapanJordanKazakhstanKenyaKiribatiKorea, Dem. People’s Rep.Korea, Rep.KuwaitKyrgyz RepublicLao PDRLate-demographic dividendLatin America & Caribbean Latin America & Caribbean (excluding high income)Latin America & the Caribbean (IDA & IBRD countries)LatviaLeast developed countries: UN classificationLebanonLesothoLiberiaLibyaLiechtensteinLithuaniaLow & middle incomeLow incomeLower middle incomeLuxembourgMacao SAR, ChinaMacedonia, FYRMadagascarMalawiMalaysiaMaldivesMaliMaltaMarshall IslandsMauritaniaMauritiusMexicoMicronesia, Fed. Sts.Middle East & North AfricaMiddle East & North Africa (excluding high income)Middle East & North Africa (IDA & IBRD countries)Middle incomeMoldovaMongoliaMontenegroMoroccoMozambiqueMyanmarNamibiaNauruNepalNetherlandsNew CaledoniaNew ZealandNicaraguaNigerNigeriaNorth AmericaNorwayOECD membersOmanOther small statesPacific island small statesPakistanPalauPanamaPapua New GuineaParaguayPeruPhilippinesPolandPortugalPost-demographic dividendPre-demographic dividendQatarRomaniaRussian FederationRwandaSamoaSao Tome and PrincipeSaudi ArabiaSenegalSerbiaSeychellesSierra LeoneSingaporeSint Maarten (Dutch part)Slovak RepublicSloveniaSmall statesSolomon IslandsSomaliaSouth AfricaSouth AsiaSouth Asia (IDA & IBRD)South SudanSpainSri LankaSt. Kitts and NevisSt. LuciaSt. Vincent and the GrenadinesSub-Saharan Africa Sub-Saharan Africa (excluding high income)Sub-Saharan Africa (IDA & IBRD countries)SudanSurinameSwazilandSwedenSwitzerlandSyrian Arab RepublicTajikistanTanzaniaThailandTimor-LesteTogoTongaTrinidad and TobagoTunisiaTurkeyTurkmenistanTurks and Caicos IslandsUgandaUkraineUnited Arab EmiratesUnited KingdomUnited StatesUpper middle incomeUruguayUzbekistanVanuatuVenezuela, RBVietnamWest Bank and GazaWorldYemen, Rep.ZambiaZimbabwe Timeline:
This timeline shows a graph from 1961 to 2014 of Least developed countries: UN classification. No data until 1960. Number of actual observations by date: 54.
Source name:
World Development Indicators
Source organization:
Carbon Dioxide Information Analysis Center, Environmental Sciences Division, Oak Ridge National Laboratory, Tennessee, United States.
Categories, topics:
Climate Change, Environment
Last updated:
apr 23, 2017
Indicators value changes by year
Minimum:
56.267
jan 1, 2012
Maximum:
80.355
jan 1, 1969
At the date of observation
Value
Absolute change
Change from previous value
jan 1, 1961
76.926
+76.926
0.0%
jan 1, 1962
77.055
+0.129
0.17%
jan 1, 1963
78.45
+1.395
1.81%
jan 1, 1964
80.302
+1.852
2.36%
jan 1, 1965
72.032
-8.27
-10.3%
jan 1, 1966
72.914
+0.882
1.22%
jan 1, 1967
75.88
+2.966
4.07%
jan 1, 1968
72.818
-3.062
-4.04%
jan 1, 1969
80.355
+7.538
10.35%
jan 1, 1970
80.13
-0.225
-0.28%
jan 1, 1971
76.13
-4.001
-4.99%
jan 1, 1972
76.064
-0.066
-0.09%
jan 1, 1973
75.615
-0.449
-0.59%
jan 1, 1974
75.646
+0.031
0.04%
jan 1, 1975
74.75
-0.896
-1.18%
jan 1, 1976
75.572
+0.822
1.1%
jan 1, 1977
76.307
+0.735
0.97%
jan 1, 1978
75.101
-1.207
-1.58%
jan 1, 1979
76.913
+1.813
2.41%
jan 1, 1980
78.814
+1.901
2.47%
jan 1, 1981
78.17
-0.645
-0.82%
jan 1, 1982
78.644
+0.474
0.61%
jan 1, 1983
76.189
-2.455
-3.12%
jan 1, 1984
76.127
-0.062
-0.08%
jan 1, 1985
73.654
-2.473
-3.25%
jan 1, 1986
72.907
-0.747
-1.01%
jan 1, 1987
72.105
-0.802
-1.1%
jan 1, 1988
74.002
+1.897
2.63%
jan 1, 1989
73.187
-0.814
-1.1%
jan 1, 1990
73.556
+0.369
0.5%
jan 1, 1991
73.738
+0.182
0.25%
jan 1, 1992
73.595
-0.143
-0.19%
jan 1, 1993
74.938
+1.343
1.83%
jan 1, 1994
71.844
-3.094
-4.13%
jan 1, 1995
71.151
-0.694
-0.97%
jan 1, 1996
72.344
+1.193
1.68%
jan 1, 1997
71.745
-0.599
-0.83%
jan 1, 1998
70.033
-1.712
-2.39%
jan 1, 1999
68.916
-1.117
-1.59%
jan 1, 2000
67.697
-1.219
-1.77%
jan 1, 2001
65.281
-2.417
-3.57%
jan 1, 2002
64.041
-1.24
-1.9%
jan 1, 2003
62.741
-1.3
-2.03%
jan 1, 2004
66.902
+4.161
6.63%
jan 1, 2005
60.542
-6.36
-9.51%
jan 1, 2006
58.718
-1.824
-3.01%
jan 1, 2007
58.316
-0.402
-0.69%
jan 1, 2008
58.007
-0.308
-0.53%
jan 1, 2009
58.814
+0.806
1.39%
jan 1, 2010
57.289
-1.524
-2.59%
jan 1, 2011
57.246
-0.043
-0.08%
jan 1, 2012
56.267
-0.979
-1.71%
jan 1, 2013
57.199
+0.932
1.66%
jan 1, 2014
58.365
+1.166
2.04%
Ranking of countries by current statistics by years


Comments: