29
/
en
AIzaSyAYiBZKx7MnpbEhh9jyipgxe19OcubqV5w
April 1, 2024
64433
Albania
ALB
true
2
1
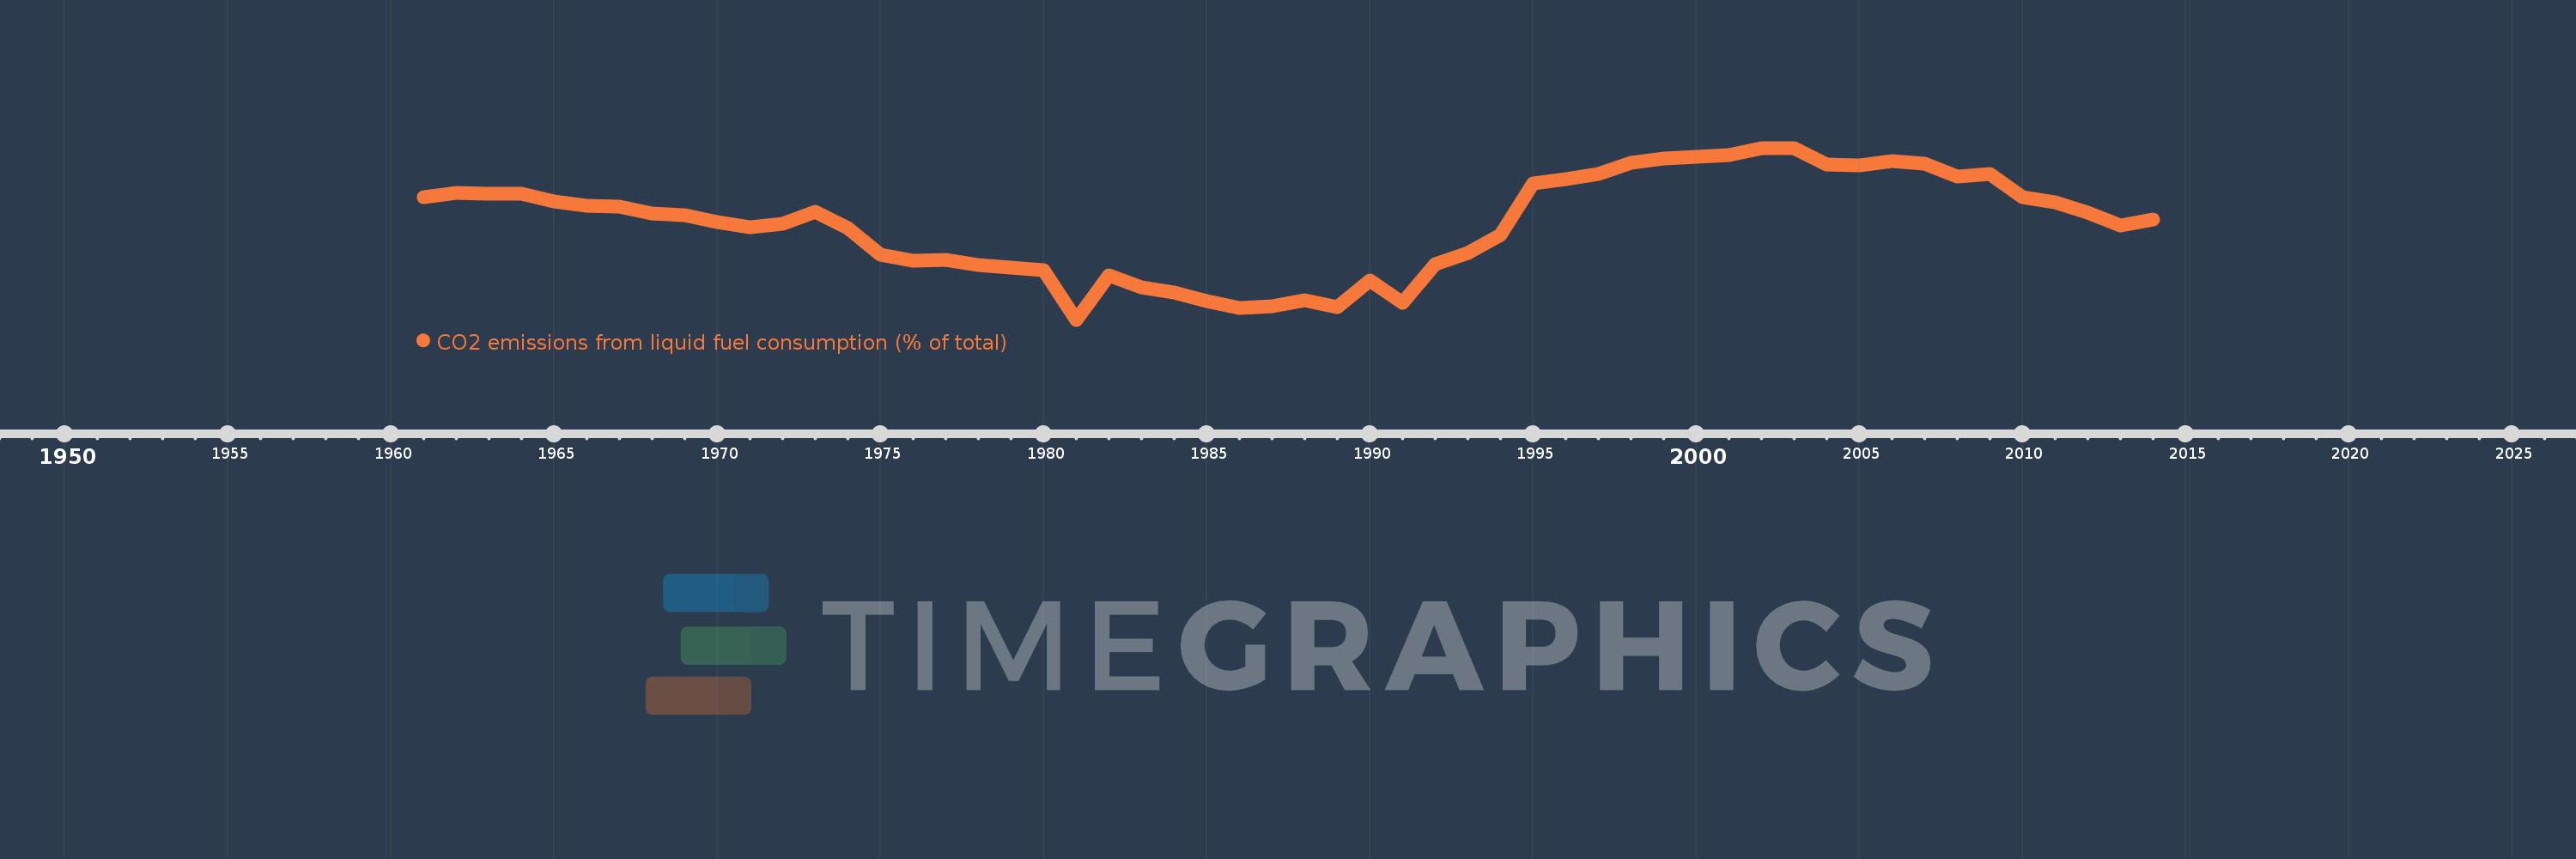
CO2 emissions from liquid fuel consumption (% of total)
2014,2013,2012,2011,2010,2009,2008,2007,2006,2005,2004,2003,2002,2001,2000,1999,1998,1997,1996,1995,1994,1993,1992,1991,1990,1989,1988,1987,1986,1985,1984,1983,1982,1981,1980,1979,1978,1977,1976,1975,1974,1973,1972,1971,1970,1969,1968,1967,1966,1965,1964,1963,1962,1961
This statistics in other country:
AfghanistanAlbaniaAlgeriaAndorraAngolaAntigua and BarbudaArab WorldArgentinaArmeniaArubaAustraliaAustriaAzerbaijanBahamas, TheBahrainBangladeshBarbadosBelarusBelgiumBelizeBeninBermudaBhutanBoliviaBosnia and HerzegovinaBotswanaBrazilBritish Virgin IslandsBrunei DarussalamBulgariaBurkina FasoBurundiCabo VerdeCambodiaCameroonCanadaCaribbean small statesCayman IslandsCentral African RepublicCentral Europe and the BalticsChadChileChinaColombiaComorosCongo, Dem. Rep.Congo, Rep.Costa RicaCote d'IvoireCroatiaCubaCuracaoCyprusCzech RepublicDenmarkDjiboutiDominicaDominican RepublicEarly-demographic dividendEast Asia & PacificEast Asia & Pacific (excluding high income)East Asia & Pacific (IDA & IBRD countries)EcuadorEgypt, Arab Rep.El SalvadorEquatorial GuineaEritreaEstoniaEthiopiaEuro areaEurope & Central AsiaEurope & Central Asia (excluding high income)Europe & Central Asia (IDA & IBRD countries)European UnionFaroe IslandsFijiFinlandFragile and conflict affected situationsFranceFrench PolynesiaGabonGambia, TheGeorgiaGermanyGhanaGibraltarGreeceGreenlandGrenadaGuatemalaGuineaGuinea-BissauGuyanaHaitiHeavily indebted poor countries (HIPC)High incomeHondurasHong Kong SAR, ChinaHungaryIBRD onlyIcelandIDA & IBRD totalIDA blendIDA onlyIDA totalIndiaIndonesiaIran, Islamic Rep.IraqIrelandIsraelItalyJamaicaJapanJordanKazakhstanKenyaKiribatiKorea, Dem. People’s Rep.Korea, Rep.KuwaitKyrgyz RepublicLao PDRLate-demographic dividendLatin America & Caribbean Latin America & Caribbean (excluding high income)Latin America & the Caribbean (IDA & IBRD countries)LatviaLeast developed countries: UN classificationLebanonLesothoLiberiaLibyaLiechtensteinLithuaniaLow & middle incomeLow incomeLower middle incomeLuxembourgMacao SAR, ChinaMacedonia, FYRMadagascarMalawiMalaysiaMaldivesMaliMaltaMarshall IslandsMauritaniaMauritiusMexicoMicronesia, Fed. Sts.Middle East & North AfricaMiddle East & North Africa (excluding high income)Middle East & North Africa (IDA & IBRD countries)Middle incomeMoldovaMongoliaMontenegroMoroccoMozambiqueMyanmarNamibiaNauruNepalNetherlandsNew CaledoniaNew ZealandNicaraguaNigerNigeriaNorth AmericaNorwayOECD membersOmanOther small statesPacific island small statesPakistanPalauPanamaPapua New GuineaParaguayPeruPhilippinesPolandPortugalPost-demographic dividendPre-demographic dividendQatarRomaniaRussian FederationRwandaSamoaSao Tome and PrincipeSaudi ArabiaSenegalSerbiaSeychellesSierra LeoneSingaporeSint Maarten (Dutch part)Slovak RepublicSloveniaSmall statesSolomon IslandsSomaliaSouth AfricaSouth AsiaSouth Asia (IDA & IBRD)South SudanSpainSri LankaSt. Kitts and NevisSt. LuciaSt. Vincent and the GrenadinesSub-Saharan Africa Sub-Saharan Africa (excluding high income)Sub-Saharan Africa (IDA & IBRD countries)SudanSurinameSwazilandSwedenSwitzerlandSyrian Arab RepublicTajikistanTanzaniaThailandTimor-LesteTogoTongaTrinidad and TobagoTunisiaTurkeyTurkmenistanTurks and Caicos IslandsUgandaUkraineUnited Arab EmiratesUnited KingdomUnited StatesUpper middle incomeUruguayUzbekistanVanuatuVenezuela, RBVietnamWest Bank and GazaWorldYemen, Rep.ZambiaZimbabwe Timeline:
This timeline shows a graph from 1961 to 2014 of Albania. No data until 1960. Number of actual observations by date: 54.
Source name:
World Development Indicators
Source organization:
Carbon Dioxide Information Analysis Center, Environmental Sciences Division, Oak Ridge National Laboratory, Tennessee, United States.
Categories, topics:
Climate Change, Environment
Last updated:
apr 23, 2017
Indicators value changes by year
Minimum:
30.426
jan 1, 1981
Maximum:
97.067
jan 1, 2003
At the date of observation
Value
Absolute change
Change from previous value
jan 1, 1961
77.899
+77.899
0.0%
jan 1, 1962
79.743
+1.844
2.37%
jan 1, 1963
79.464
-0.278
-0.35%
jan 1, 1964
79.225
-0.239
-0.3%
jan 1, 1965
76.182
-3.044
-3.84%
jan 1, 1966
74.705
-1.477
-1.94%
jan 1, 1967
74.425
-0.28
-0.37%
jan 1, 1968
71.546
-2.879
-3.87%
jan 1, 1969
71.122
-0.424
-0.59%
jan 1, 1970
68.475
-2.647
-3.72%
jan 1, 1971
66.308
-2.167
-3.16%
jan 1, 1972
67.565
+1.258
1.9%
jan 1, 1973
72.385
+4.819
7.13%
jan 1, 1974
66.112
-6.272
-8.67%
jan 1, 1975
55.781
-10.332
-15.63%
jan 1, 1976
53.472
-2.309
-4.14%
jan 1, 1977
53.63
+0.158
0.3%
jan 1, 1978
51.538
-2.091
-3.9%
jan 1, 1979
50.593
-0.946
-1.83%
jan 1, 1980
49.783
-0.81
-1.6%
jan 1, 1981
30.426
-19.357
-38.88%
jan 1, 1982
47.652
+17.227
56.62%
jan 1, 1983
43.051
-4.602
-9.66%
jan 1, 1984
41.038
-2.013
-4.68%
jan 1, 1985
37.676
-3.362
-8.19%
jan 1, 1986
34.993
-2.683
-7.12%
jan 1, 1987
35.64
+0.646
1.85%
jan 1, 1988
37.931
+2.292
6.43%
jan 1, 1989
35.185
-2.746
-7.24%
jan 1, 1990
45.633
+10.447
29.69%
jan 1, 1991
37.086
-8.547
-18.73%
jan 1, 1992
52.01
+14.925
40.24%
jan 1, 1993
56.268
+4.258
8.19%
jan 1, 1994
63.422
+7.154
12.71%
jan 1, 1995
83.429
+20.006
31.54%
jan 1, 1996
85.062
+1.633
1.96%
jan 1, 1997
87.091
+2.029
2.39%
jan 1, 1998
91.449
+4.358
5.0%
jan 1, 1999
92.887
+1.438
1.57%
jan 1, 2000
93.489
+0.602
0.65%
jan 1, 2001
94.175
+0.686
0.73%
jan 1, 2002
97.042
+2.867
3.04%
jan 1, 2003
97.067
+0.025
0.03%
jan 1, 2004
90.692
-6.376
-6.57%
jan 1, 2005
90.317
-0.375
-0.41%
jan 1, 2006
92.069
+1.752
1.94%
jan 1, 2007
90.969
-1.1
-1.19%
jan 1, 2008
86.088
-4.881
-5.37%
jan 1, 2009
86.84
+0.752
0.87%
jan 1, 2010
78.057
-8.783
-10.11%
jan 1, 2011
75.997
-2.06
-2.64%
jan 1, 2012
72.078
-3.918
-5.16%
jan 1, 2013
67.004
-5.074
-7.04%
jan 1, 2014
69.231
+2.227
3.32%
Ranking of countries by current statistics by years


Comments: