29
/
en
AIzaSyAYiBZKx7MnpbEhh9jyipgxe19OcubqV5w
April 1, 2024
202660
Mozambique
MOZ
true
2
1
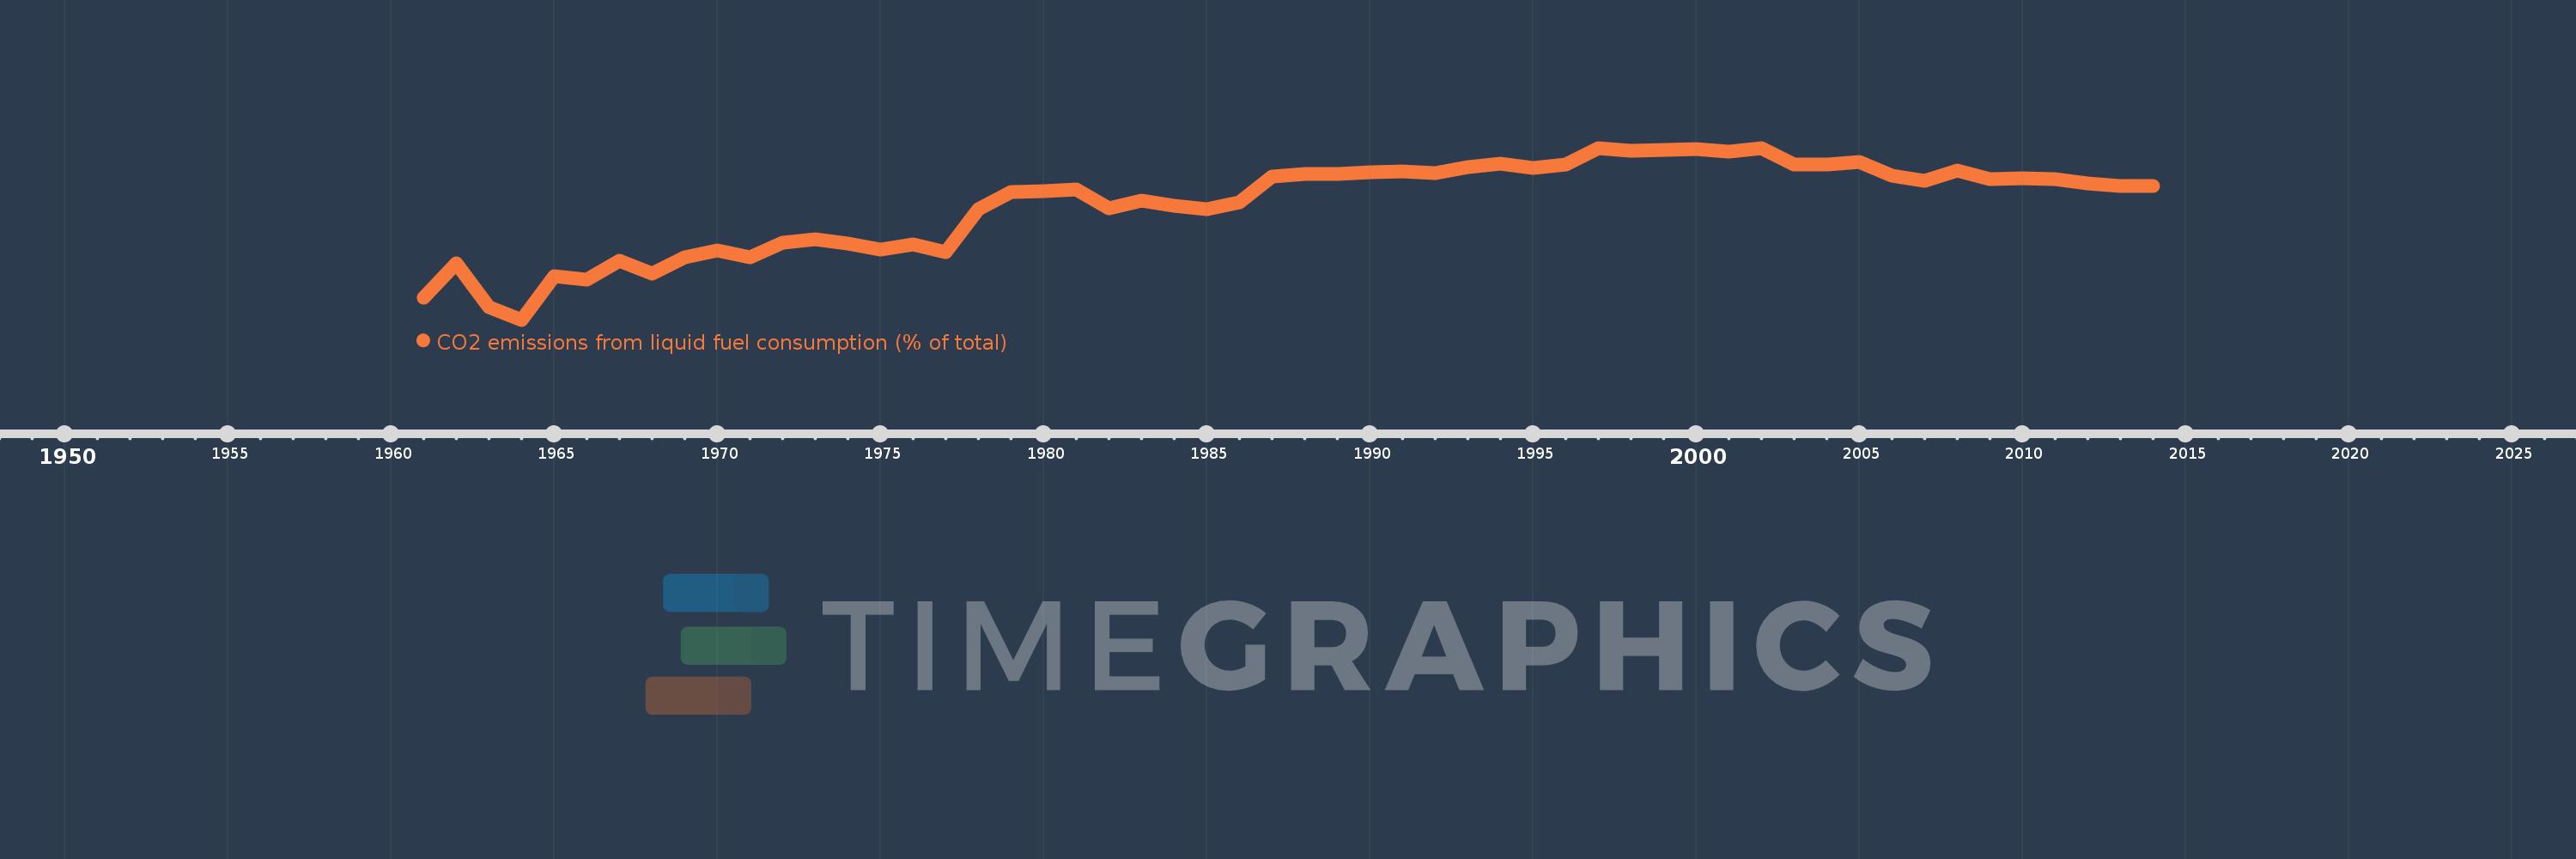
CO2 emissions from liquid fuel consumption (% of total)
2014,2013,2012,2011,2010,2009,2008,2007,2006,2005,2004,2003,2002,2001,2000,1999,1998,1997,1996,1995,1994,1993,1992,1991,1990,1989,1988,1987,1986,1985,1984,1983,1982,1981,1980,1979,1978,1977,1976,1975,1974,1973,1972,1971,1970,1969,1968,1967,1966,1965,1964,1963,1962,1961
This statistics in other country:
AfghanistanAlbaniaAlgeriaAndorraAngolaAntigua and BarbudaArab WorldArgentinaArmeniaArubaAustraliaAustriaAzerbaijanBahamas, TheBahrainBangladeshBarbadosBelarusBelgiumBelizeBeninBermudaBhutanBoliviaBosnia and HerzegovinaBotswanaBrazilBritish Virgin IslandsBrunei DarussalamBulgariaBurkina FasoBurundiCabo VerdeCambodiaCameroonCanadaCaribbean small statesCayman IslandsCentral African RepublicCentral Europe and the BalticsChadChileChinaColombiaComorosCongo, Dem. Rep.Congo, Rep.Costa RicaCote d'IvoireCroatiaCubaCuracaoCyprusCzech RepublicDenmarkDjiboutiDominicaDominican RepublicEarly-demographic dividendEast Asia & PacificEast Asia & Pacific (excluding high income)East Asia & Pacific (IDA & IBRD countries)EcuadorEgypt, Arab Rep.El SalvadorEquatorial GuineaEritreaEstoniaEthiopiaEuro areaEurope & Central AsiaEurope & Central Asia (excluding high income)Europe & Central Asia (IDA & IBRD countries)European UnionFaroe IslandsFijiFinlandFragile and conflict affected situationsFranceFrench PolynesiaGabonGambia, TheGeorgiaGermanyGhanaGibraltarGreeceGreenlandGrenadaGuatemalaGuineaGuinea-BissauGuyanaHaitiHeavily indebted poor countries (HIPC)High incomeHondurasHong Kong SAR, ChinaHungaryIBRD onlyIcelandIDA & IBRD totalIDA blendIDA onlyIDA totalIndiaIndonesiaIran, Islamic Rep.IraqIrelandIsraelItalyJamaicaJapanJordanKazakhstanKenyaKiribatiKorea, Dem. People’s Rep.Korea, Rep.KuwaitKyrgyz RepublicLao PDRLate-demographic dividendLatin America & Caribbean Latin America & Caribbean (excluding high income)Latin America & the Caribbean (IDA & IBRD countries)LatviaLeast developed countries: UN classificationLebanonLesothoLiberiaLibyaLiechtensteinLithuaniaLow & middle incomeLow incomeLower middle incomeLuxembourgMacao SAR, ChinaMacedonia, FYRMadagascarMalawiMalaysiaMaldivesMaliMaltaMarshall IslandsMauritaniaMauritiusMexicoMicronesia, Fed. Sts.Middle East & North AfricaMiddle East & North Africa (excluding high income)Middle East & North Africa (IDA & IBRD countries)Middle incomeMoldovaMongoliaMontenegroMoroccoMozambiqueMyanmarNamibiaNauruNepalNetherlandsNew CaledoniaNew ZealandNicaraguaNigerNigeriaNorth AmericaNorwayOECD membersOmanOther small statesPacific island small statesPakistanPalauPanamaPapua New GuineaParaguayPeruPhilippinesPolandPortugalPost-demographic dividendPre-demographic dividendQatarRomaniaRussian FederationRwandaSamoaSao Tome and PrincipeSaudi ArabiaSenegalSerbiaSeychellesSierra LeoneSingaporeSint Maarten (Dutch part)Slovak RepublicSloveniaSmall statesSolomon IslandsSomaliaSouth AfricaSouth AsiaSouth Asia (IDA & IBRD)South SudanSpainSri LankaSt. Kitts and NevisSt. LuciaSt. Vincent and the GrenadinesSub-Saharan Africa Sub-Saharan Africa (excluding high income)Sub-Saharan Africa (IDA & IBRD countries)SudanSurinameSwazilandSwedenSwitzerlandSyrian Arab RepublicTajikistanTanzaniaThailandTimor-LesteTogoTongaTrinidad and TobagoTunisiaTurkeyTurkmenistanTurks and Caicos IslandsUgandaUkraineUnited Arab EmiratesUnited KingdomUnited StatesUpper middle incomeUruguayUzbekistanVanuatuVenezuela, RBVietnamWest Bank and GazaWorldYemen, Rep.ZambiaZimbabwe Timeline:
This timeline shows a graph from 1961 to 2014 of Mozambique. No data until 1960. Number of actual observations by date: 54.
Source name:
World Development Indicators
Source organization:
Carbon Dioxide Information Analysis Center, Environmental Sciences Division, Oak Ridge National Laboratory, Tennessee, United States.
Categories, topics:
Climate Change, Environment
Last updated:
apr 23, 2017
Indicators value changes by year
Minimum:
13.024
jan 1, 1964
Maximum:
91.549
jan 1, 1997
At the date of observation
Value
Absolute change
Change from previous value
jan 1, 1961
23.152
+23.152
0.0%
jan 1, 1962
38.997
+15.845
68.44%
jan 1, 1963
18.819
-20.178
-51.74%
jan 1, 1964
13.024
-5.795
-30.79%
jan 1, 1965
33.048
+20.024
153.74%
jan 1, 1966
31.261
-1.787
-5.41%
jan 1, 1967
40.0
+8.739
27.95%
jan 1, 1968
34.051
-5.949
-14.87%
jan 1, 1969
41.557
+7.506
22.04%
jan 1, 1970
44.683
+3.127
7.52%
jan 1, 1971
41.646
-3.037
-6.8%
jan 1, 1972
48.276
+6.63
15.92%
jan 1, 1973
49.667
+1.391
2.88%
jan 1, 1974
47.737
-1.93
-3.89%
jan 1, 1975
45.169
-2.568
-5.38%
jan 1, 1976
47.649
+2.481
5.49%
jan 1, 1977
43.983
-3.666
-7.69%
jan 1, 1978
63.378
+19.396
44.1%
jan 1, 1979
71.556
+8.178
12.9%
jan 1, 1980
71.706
+0.15
0.21%
jan 1, 1981
72.571
+0.865
1.21%
jan 1, 1982
64.065
-8.507
-11.72%
jan 1, 1983
67.677
+3.612
5.64%
jan 1, 1984
65.121
-2.556
-3.78%
jan 1, 1985
63.723
-1.397
-2.15%
jan 1, 1986
66.773
+3.05
4.79%
jan 1, 1987
78.358
+11.585
17.35%
jan 1, 1988
79.478
+1.119
1.43%
jan 1, 1989
79.71
+0.233
0.29%
jan 1, 1990
80.282
+0.572
0.72%
jan 1, 1991
81.004
+0.722
0.9%
jan 1, 1992
79.928
-1.075
-1.33%
jan 1, 1993
82.847
+2.918
3.65%
jan 1, 1994
84.354
+1.507
1.82%
jan 1, 1995
82.414
-1.94
-2.3%
jan 1, 1996
83.882
+1.468
1.78%
jan 1, 1997
91.549
+7.668
9.14%
jan 1, 1998
90.228
-1.321
-1.44%
jan 1, 1999
90.615
+0.387
0.43%
jan 1, 2000
91.049
+0.434
0.48%
jan 1, 2001
89.946
-1.104
-1.21%
jan 1, 2002
91.415
+1.47
1.63%
jan 1, 2003
84.065
-7.351
-8.04%
jan 1, 2004
84.13
+0.065
0.08%
jan 1, 2005
85.305
+1.175
1.4%
jan 1, 2006
78.873
-6.432
-7.54%
jan 1, 2007
76.667
-2.207
-2.8%
jan 1, 2008
81.361
+4.695
6.12%
jan 1, 2009
77.184
-4.177
-5.13%
jan 1, 2010
77.681
+0.497
0.64%
jan 1, 2011
77.346
-0.335
-0.43%
jan 1, 2012
75.313
-2.033
-2.63%
jan 1, 2013
74.266
-1.047
-1.39%
jan 1, 2014
73.996
-0.269
-0.36%
Ranking of countries by current statistics by years


Comments: