29
/
en
AIzaSyAYiBZKx7MnpbEhh9jyipgxe19OcubqV5w
April 1, 2024
256132
Sweden
SWE
true
2
1
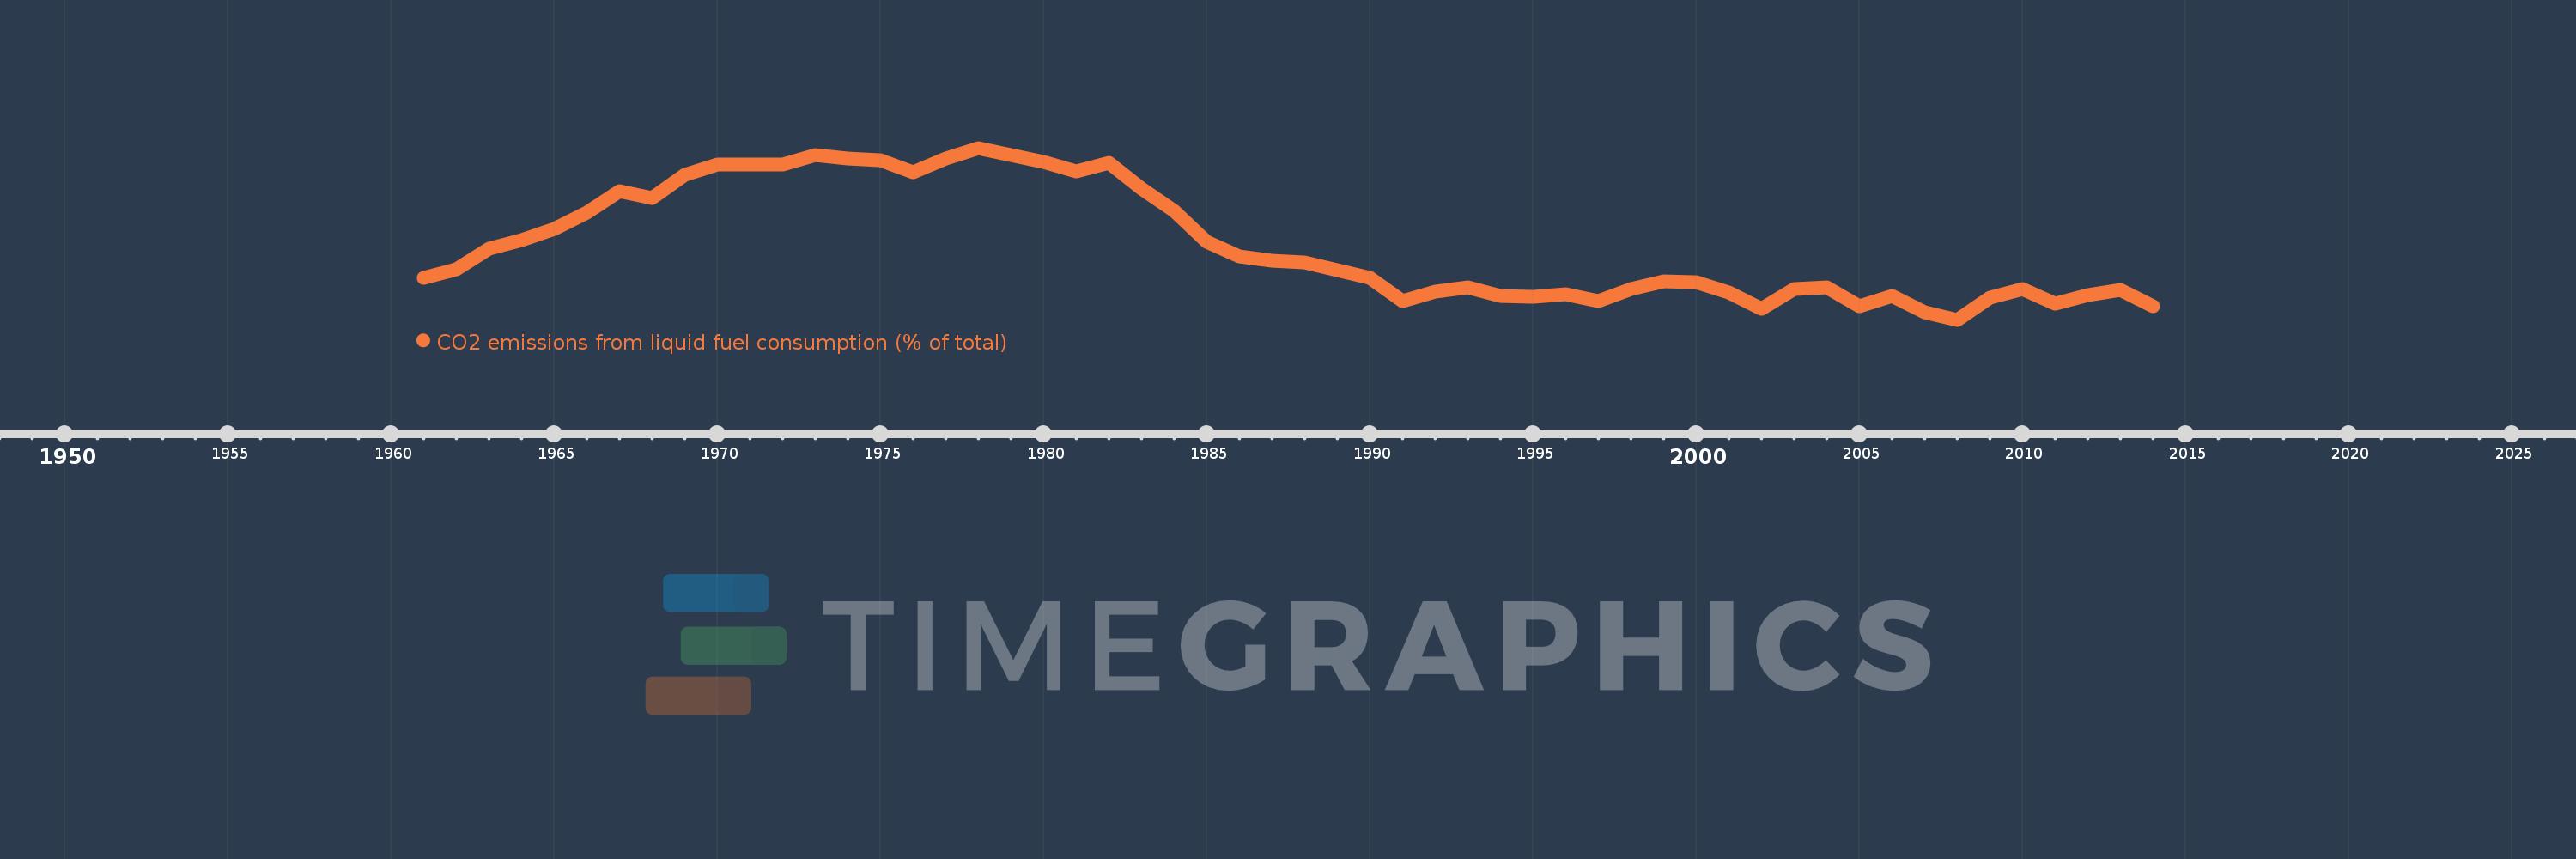
CO2 emissions from liquid fuel consumption (% of total)
2014,2013,2012,2011,2010,2009,2008,2007,2006,2005,2004,2003,2002,2001,2000,1999,1998,1997,1996,1995,1994,1993,1992,1991,1990,1989,1988,1987,1986,1985,1984,1983,1982,1981,1980,1979,1978,1977,1976,1975,1974,1973,1972,1971,1970,1969,1968,1967,1966,1965,1964,1963,1962,1961
This statistics in other country:
AfghanistanAlbaniaAlgeriaAndorraAngolaAntigua and BarbudaArab WorldArgentinaArmeniaArubaAustraliaAustriaAzerbaijanBahamas, TheBahrainBangladeshBarbadosBelarusBelgiumBelizeBeninBermudaBhutanBoliviaBosnia and HerzegovinaBotswanaBrazilBritish Virgin IslandsBrunei DarussalamBulgariaBurkina FasoBurundiCabo VerdeCambodiaCameroonCanadaCaribbean small statesCayman IslandsCentral African RepublicCentral Europe and the BalticsChadChileChinaColombiaComorosCongo, Dem. Rep.Congo, Rep.Costa RicaCote d'IvoireCroatiaCubaCuracaoCyprusCzech RepublicDenmarkDjiboutiDominicaDominican RepublicEarly-demographic dividendEast Asia & PacificEast Asia & Pacific (excluding high income)East Asia & Pacific (IDA & IBRD countries)EcuadorEgypt, Arab Rep.El SalvadorEquatorial GuineaEritreaEstoniaEthiopiaEuro areaEurope & Central AsiaEurope & Central Asia (excluding high income)Europe & Central Asia (IDA & IBRD countries)European UnionFaroe IslandsFijiFinlandFragile and conflict affected situationsFranceFrench PolynesiaGabonGambia, TheGeorgiaGermanyGhanaGibraltarGreeceGreenlandGrenadaGuatemalaGuineaGuinea-BissauGuyanaHaitiHeavily indebted poor countries (HIPC)High incomeHondurasHong Kong SAR, ChinaHungaryIBRD onlyIcelandIDA & IBRD totalIDA blendIDA onlyIDA totalIndiaIndonesiaIran, Islamic Rep.IraqIrelandIsraelItalyJamaicaJapanJordanKazakhstanKenyaKiribatiKorea, Dem. People’s Rep.Korea, Rep.KuwaitKyrgyz RepublicLao PDRLate-demographic dividendLatin America & Caribbean Latin America & Caribbean (excluding high income)Latin America & the Caribbean (IDA & IBRD countries)LatviaLeast developed countries: UN classificationLebanonLesothoLiberiaLibyaLiechtensteinLithuaniaLow & middle incomeLow incomeLower middle incomeLuxembourgMacao SAR, ChinaMacedonia, FYRMadagascarMalawiMalaysiaMaldivesMaliMaltaMarshall IslandsMauritaniaMauritiusMexicoMicronesia, Fed. Sts.Middle East & North AfricaMiddle East & North Africa (excluding high income)Middle East & North Africa (IDA & IBRD countries)Middle incomeMoldovaMongoliaMontenegroMoroccoMozambiqueMyanmarNamibiaNauruNepalNetherlandsNew CaledoniaNew ZealandNicaraguaNigerNigeriaNorth AmericaNorwayOECD membersOmanOther small statesPacific island small statesPakistanPalauPanamaPapua New GuineaParaguayPeruPhilippinesPolandPortugalPost-demographic dividendPre-demographic dividendQatarRomaniaRussian FederationRwandaSamoaSao Tome and PrincipeSaudi ArabiaSenegalSerbiaSeychellesSierra LeoneSingaporeSint Maarten (Dutch part)Slovak RepublicSloveniaSmall statesSolomon IslandsSomaliaSouth AfricaSouth AsiaSouth Asia (IDA & IBRD)South SudanSpainSri LankaSt. Kitts and NevisSt. LuciaSt. Vincent and the GrenadinesSub-Saharan Africa Sub-Saharan Africa (excluding high income)Sub-Saharan Africa (IDA & IBRD countries)SudanSurinameSwazilandSwedenSwitzerlandSyrian Arab RepublicTajikistanTanzaniaThailandTimor-LesteTogoTongaTrinidad and TobagoTunisiaTurkeyTurkmenistanTurks and Caicos IslandsUgandaUkraineUnited Arab EmiratesUnited KingdomUnited StatesUpper middle incomeUruguayUzbekistanVanuatuVenezuela, RBVietnamWest Bank and GazaWorldYemen, Rep.ZambiaZimbabwe Timeline:
This timeline shows a graph from 1961 to 2014 of Sweden. No data until 1960. Number of actual observations by date: 54.
Source name:
World Development Indicators
Source organization:
Carbon Dioxide Information Analysis Center, Environmental Sciences Division, Oak Ridge National Laboratory, Tennessee, United States.
Categories, topics:
Climate Change, Environment
Last updated:
apr 23, 2017
Indicators value changes by year
Minimum:
71.586
jan 1, 2008
Maximum:
92.209
jan 1, 1978
At the date of observation
Value
Absolute change
Change from previous value
jan 1, 1961
76.585
+76.585
0.0%
jan 1, 1962
77.669
+1.084
1.41%
jan 1, 1963
80.096
+2.427
3.13%
jan 1, 1964
81.113
+1.017
1.27%
jan 1, 1965
82.512
+1.4
1.73%
jan 1, 1966
84.431
+1.919
2.33%
jan 1, 1967
86.992
+2.561
3.03%
jan 1, 1968
86.246
-0.746
-0.86%
jan 1, 1969
88.964
+2.717
3.15%
jan 1, 1970
90.229
+1.265
1.42%
jan 1, 1971
90.231
+0.002
0.0%
jan 1, 1972
90.199
-0.032
-0.04%
jan 1, 1973
91.319
+1.121
1.24%
jan 1, 1974
90.946
-0.373
-0.41%
jan 1, 1975
90.687
-0.26
-0.29%
jan 1, 1976
89.297
-1.389
-1.53%
jan 1, 1977
90.927
+1.63
1.82%
jan 1, 1978
92.209
+1.282
1.41%
jan 1, 1979
91.392
-0.817
-0.89%
jan 1, 1980
90.492
-0.9
-0.98%
jan 1, 1981
89.366
-1.126
-1.24%
jan 1, 1982
90.462
+1.096
1.23%
jan 1, 1983
87.343
-3.118
-3.45%
jan 1, 1984
84.608
-2.735
-3.13%
jan 1, 1985
80.921
-3.687
-4.36%
jan 1, 1986
79.212
-1.709
-2.11%
jan 1, 1987
78.697
-0.515
-0.65%
jan 1, 1988
78.453
-0.245
-0.31%
jan 1, 1989
77.542
-0.91
-1.16%
jan 1, 1990
76.651
-0.891
-1.15%
jan 1, 1991
73.874
-2.777
-3.62%
jan 1, 1992
74.963
+1.089
1.47%
jan 1, 1993
75.516
+0.553
0.74%
jan 1, 1994
74.451
-1.065
-1.41%
jan 1, 1995
74.322
-0.129
-0.17%
jan 1, 1996
74.683
+0.361
0.49%
jan 1, 1997
73.837
-0.845
-1.13%
jan 1, 1998
75.234
+1.396
1.89%
jan 1, 1999
76.154
+0.92
1.22%
jan 1, 2000
76.114
-0.04
-0.05%
jan 1, 2001
74.877
-1.237
-1.62%
jan 1, 2002
72.895
-1.983
-2.65%
jan 1, 2003
75.243
+2.348
3.22%
jan 1, 2004
75.474
+0.231
0.31%
jan 1, 2005
73.245
-2.229
-2.95%
jan 1, 2006
74.433
+1.188
1.62%
jan 1, 2007
72.474
-1.959
-2.63%
jan 1, 2008
71.586
-0.888
-1.23%
jan 1, 2009
74.283
+2.698
3.77%
jan 1, 2010
75.255
+0.972
1.31%
jan 1, 2011
73.525
-1.73
-2.3%
jan 1, 2012
74.525
+1.0
1.36%
jan 1, 2013
75.175
+0.65
0.87%
jan 1, 2014
73.238
-1.937
-2.58%
Ranking of countries by current statistics by years


Comments: