29
/
en
AIzaSyAYiBZKx7MnpbEhh9jyipgxe19OcubqV5w
April 1, 2024
239067
Sierra Leone
SLE
true
2
1
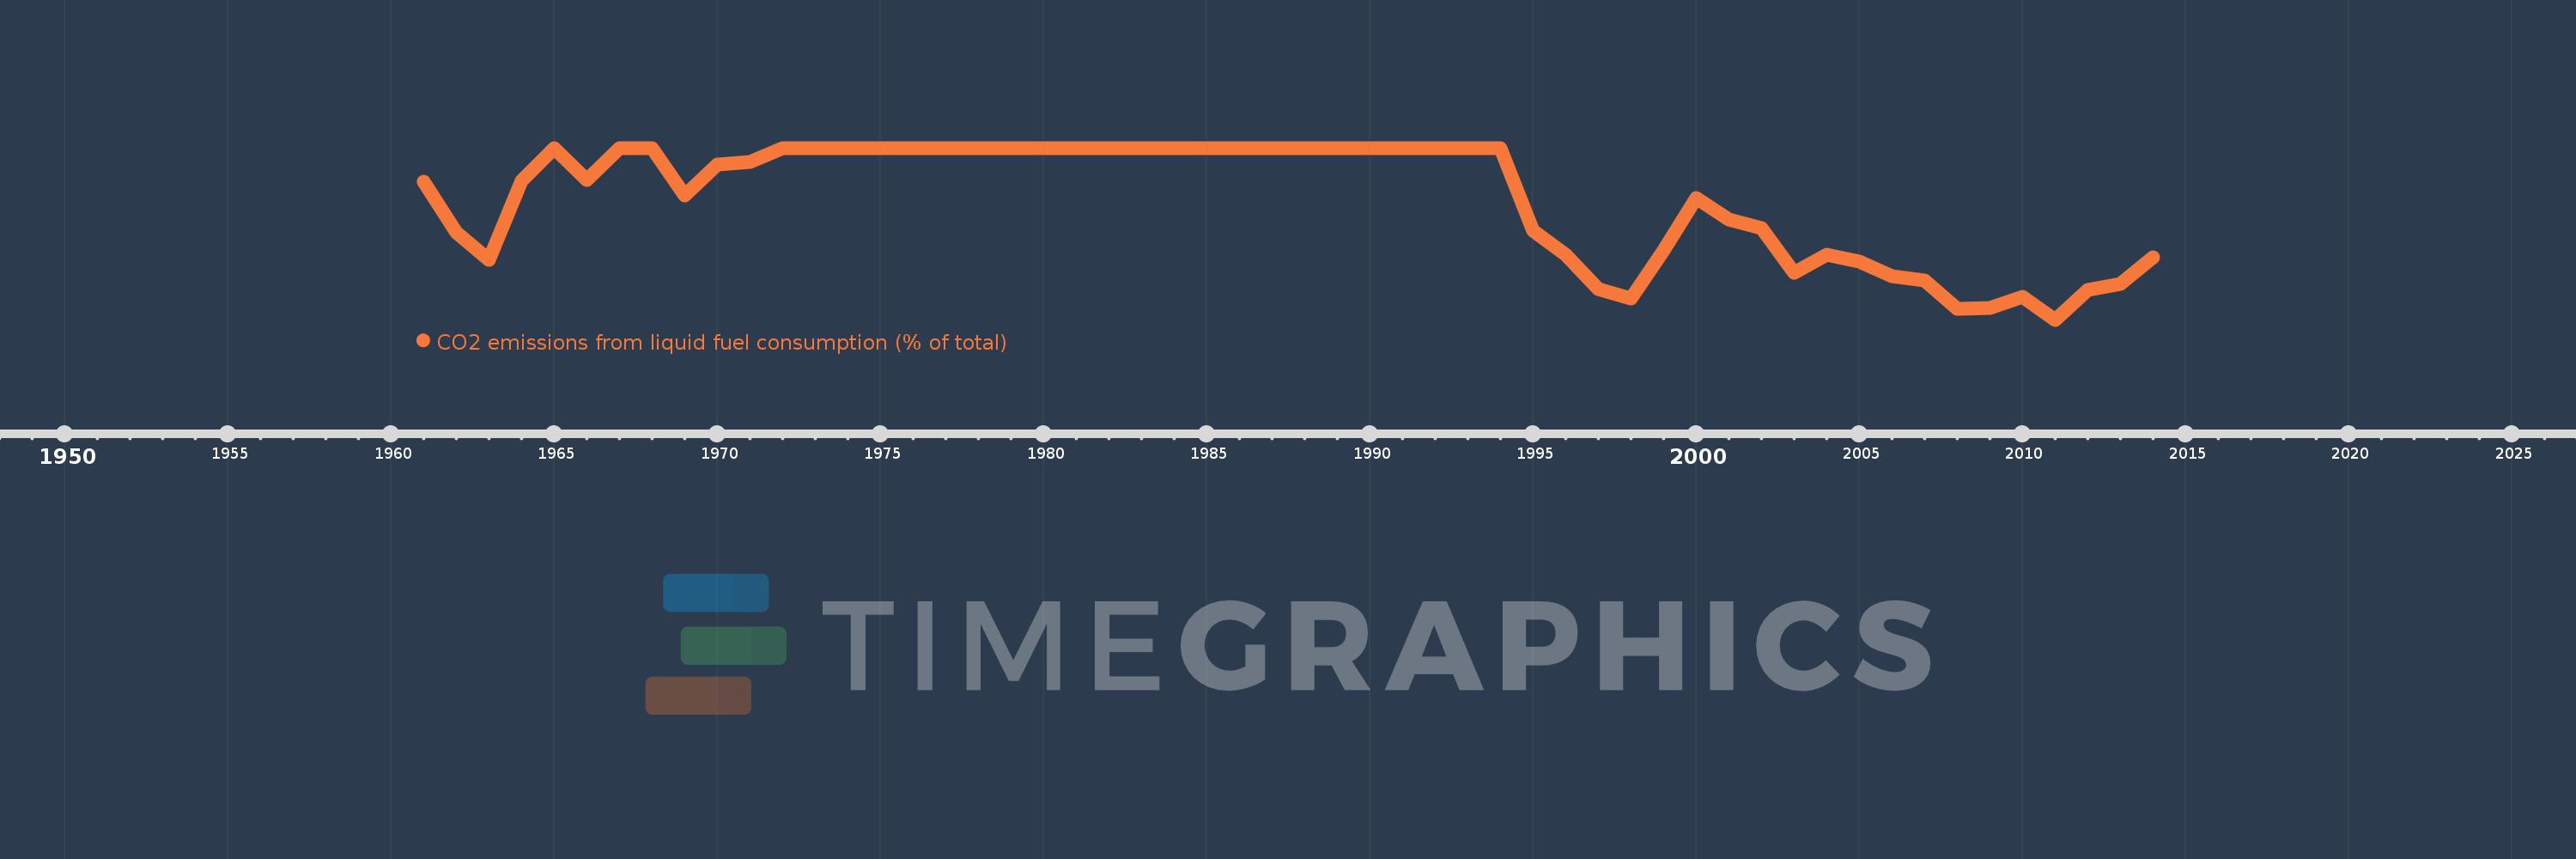
CO2 emissions from liquid fuel consumption (% of total)
2014,2013,2012,2011,2010,2009,2008,2007,2006,2005,2004,2003,2002,2001,2000,1999,1998,1997,1996,1995,1994,1993,1992,1991,1990,1989,1988,1987,1986,1985,1984,1983,1982,1981,1980,1979,1978,1977,1976,1975,1974,1973,1972,1971,1970,1969,1968,1967,1966,1965,1964,1963,1962,1961
This statistics in other country:
AfghanistanAlbaniaAlgeriaAndorraAngolaAntigua and BarbudaArab WorldArgentinaArmeniaArubaAustraliaAustriaAzerbaijanBahamas, TheBahrainBangladeshBarbadosBelarusBelgiumBelizeBeninBermudaBhutanBoliviaBosnia and HerzegovinaBotswanaBrazilBritish Virgin IslandsBrunei DarussalamBulgariaBurkina FasoBurundiCabo VerdeCambodiaCameroonCanadaCaribbean small statesCayman IslandsCentral African RepublicCentral Europe and the BalticsChadChileChinaColombiaComorosCongo, Dem. Rep.Congo, Rep.Costa RicaCote d'IvoireCroatiaCubaCuracaoCyprusCzech RepublicDenmarkDjiboutiDominicaDominican RepublicEarly-demographic dividendEast Asia & PacificEast Asia & Pacific (excluding high income)East Asia & Pacific (IDA & IBRD countries)EcuadorEgypt, Arab Rep.El SalvadorEquatorial GuineaEritreaEstoniaEthiopiaEuro areaEurope & Central AsiaEurope & Central Asia (excluding high income)Europe & Central Asia (IDA & IBRD countries)European UnionFaroe IslandsFijiFinlandFragile and conflict affected situationsFranceFrench PolynesiaGabonGambia, TheGeorgiaGermanyGhanaGibraltarGreeceGreenlandGrenadaGuatemalaGuineaGuinea-BissauGuyanaHaitiHeavily indebted poor countries (HIPC)High incomeHondurasHong Kong SAR, ChinaHungaryIBRD onlyIcelandIDA & IBRD totalIDA blendIDA onlyIDA totalIndiaIndonesiaIran, Islamic Rep.IraqIrelandIsraelItalyJamaicaJapanJordanKazakhstanKenyaKiribatiKorea, Dem. People’s Rep.Korea, Rep.KuwaitKyrgyz RepublicLao PDRLate-demographic dividendLatin America & Caribbean Latin America & Caribbean (excluding high income)Latin America & the Caribbean (IDA & IBRD countries)LatviaLeast developed countries: UN classificationLebanonLesothoLiberiaLibyaLiechtensteinLithuaniaLow & middle incomeLow incomeLower middle incomeLuxembourgMacao SAR, ChinaMacedonia, FYRMadagascarMalawiMalaysiaMaldivesMaliMaltaMarshall IslandsMauritaniaMauritiusMexicoMicronesia, Fed. Sts.Middle East & North AfricaMiddle East & North Africa (excluding high income)Middle East & North Africa (IDA & IBRD countries)Middle incomeMoldovaMongoliaMontenegroMoroccoMozambiqueMyanmarNamibiaNauruNepalNetherlandsNew CaledoniaNew ZealandNicaraguaNigerNigeriaNorth AmericaNorwayOECD membersOmanOther small statesPacific island small statesPakistanPalauPanamaPapua New GuineaParaguayPeruPhilippinesPolandPortugalPost-demographic dividendPre-demographic dividendQatarRomaniaRussian FederationRwandaSamoaSao Tome and PrincipeSaudi ArabiaSenegalSerbiaSeychellesSierra LeoneSingaporeSint Maarten (Dutch part)Slovak RepublicSloveniaSmall statesSolomon IslandsSomaliaSouth AfricaSouth AsiaSouth Asia (IDA & IBRD)South SudanSpainSri LankaSt. Kitts and NevisSt. LuciaSt. Vincent and the GrenadinesSub-Saharan Africa Sub-Saharan Africa (excluding high income)Sub-Saharan Africa (IDA & IBRD countries)SudanSurinameSwazilandSwedenSwitzerlandSyrian Arab RepublicTajikistanTanzaniaThailandTimor-LesteTogoTongaTrinidad and TobagoTunisiaTurkeyTurkmenistanTurks and Caicos IslandsUgandaUkraineUnited Arab EmiratesUnited KingdomUnited StatesUpper middle incomeUruguayUzbekistanVanuatuVenezuela, RBVietnamWest Bank and GazaWorldYemen, Rep.ZambiaZimbabwe Timeline:
This timeline shows a graph from 1961 to 2014 of Sierra Leone. No data until 1960. Number of actual observations by date: 54.
Source name:
World Development Indicators
Source organization:
Carbon Dioxide Information Analysis Center, Environmental Sciences Division, Oak Ridge National Laboratory, Tennessee, United States.
Categories, topics:
Climate Change, Environment
Last updated:
apr 23, 2017
Indicators value changes by year
Minimum:
79.293
jan 1, 2011
At the date of observation
Value
Absolute change
Change from previous value
jan 1, 1961
95.897
+95.897
0.0%
jan 1, 1962
89.873
-6.024
-6.28%
jan 1, 1963
86.517
-3.357
-3.73%
jan 1, 1964
96.04
+9.523
11.01%
jan 1, 1965
100.0
+3.96
4.12%
jan 1, 1966
96.104
-3.896
-3.9%
jan 1, 1967
100.0
+3.896
4.05%
jan 1, 1968
100.0
0.0
0.0%
jan 1, 1969
94.286
-5.714
-5.71%
jan 1, 1970
98.013
+3.728
3.95%
jan 1, 1971
98.319
+0.306
0.31%
jan 1, 1972
100.0
+1.681
1.71%
jan 1, 1973
100.0
0.0
0.0%
jan 1, 1974
100.0
0.0
0.0%
jan 1, 1975
100.0
0.0
0.0%
jan 1, 1976
100.0
0.0
0.0%
jan 1, 1977
100.0
0.0
0.0%
jan 1, 1978
100.0
0.0
0.0%
jan 1, 1979
100.0
0.0
0.0%
jan 1, 1980
100.0
0.0
0.0%
jan 1, 1981
100.0
0.0
0.0%
jan 1, 1982
100.0
0.0
0.0%
jan 1, 1983
100.0
0.0
0.0%
jan 1, 1984
100.0
0.0
0.0%
jan 1, 1985
100.0
0.0
0.0%
jan 1, 1986
100.0
0.0
0.0%
jan 1, 1987
100.0
0.0
0.0%
jan 1, 1988
100.0
0.0
0.0%
jan 1, 1989
100.0
0.0
0.0%
jan 1, 1990
100.0
0.0
0.0%
jan 1, 1991
100.0
0.0
0.0%
jan 1, 1992
100.0
0.0
0.0%
jan 1, 1993
100.0
0.0
0.0%
jan 1, 1994
100.0
0.0
0.0%
jan 1, 1995
90.0
-10.0
-10.0%
jan 1, 1996
87.156
-2.844
-3.16%
jan 1, 1997
82.946
-4.21
-4.83%
jan 1, 1998
81.818
-1.128
-1.36%
jan 1, 1999
87.611
+5.792
7.08%
jan 1, 2000
94.0
+6.389
7.29%
jan 1, 2001
91.379
-2.621
-2.79%
jan 1, 2002
90.323
-1.057
-1.16%
jan 1, 2003
84.94
-5.383
-5.96%
jan 1, 2004
87.079
+2.139
2.52%
jan 1, 2005
86.286
-0.793
-0.91%
jan 1, 2006
84.564
-1.722
-2.0%
jan 1, 2007
84.0
-0.564
-0.67%
jan 1, 2008
80.571
-3.429
-4.08%
jan 1, 2009
80.663
+0.092
0.11%
jan 1, 2010
82.022
+1.359
1.69%
jan 1, 2011
79.293
-2.73
-3.33%
jan 1, 2012
82.857
+3.564
4.49%
jan 1, 2013
83.63
+0.773
0.93%
jan 1, 2014
86.769
+3.139
3.75%
Ranking of countries by current statistics by years


Comments: