29
/
en
AIzaSyAYiBZKx7MnpbEhh9jyipgxe19OcubqV5w
April 1, 2024
144114
Guatemala
GTM
true
2
1
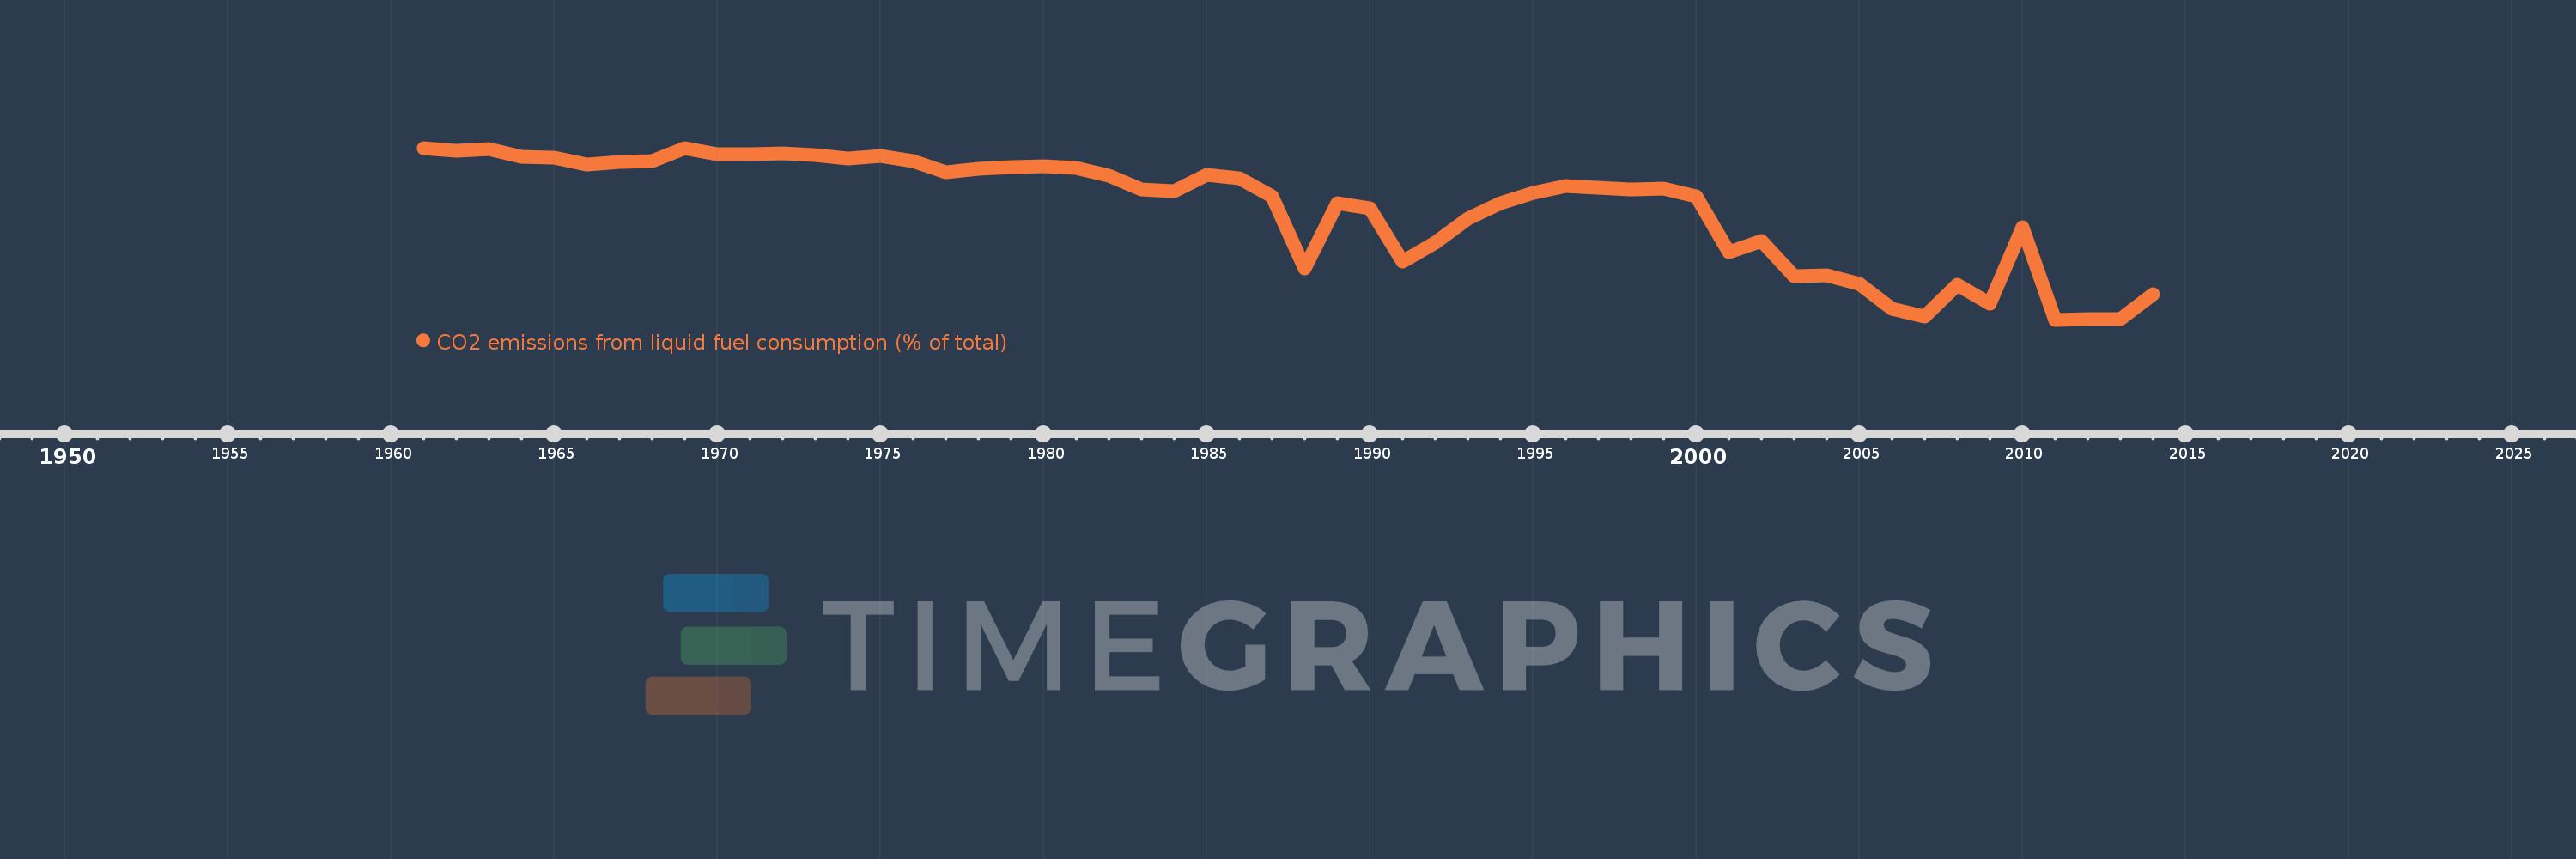
CO2 emissions from liquid fuel consumption (% of total)
2014,2013,2012,2011,2010,2009,2008,2007,2006,2005,2004,2003,2002,2001,2000,1999,1998,1997,1996,1995,1994,1993,1992,1991,1990,1989,1988,1987,1986,1985,1984,1983,1982,1981,1980,1979,1978,1977,1976,1975,1974,1973,1972,1971,1970,1969,1968,1967,1966,1965,1964,1963,1962,1961
This statistics in other country:
AfghanistanAlbaniaAlgeriaAndorraAngolaAntigua and BarbudaArab WorldArgentinaArmeniaArubaAustraliaAustriaAzerbaijanBahamas, TheBahrainBangladeshBarbadosBelarusBelgiumBelizeBeninBermudaBhutanBoliviaBosnia and HerzegovinaBotswanaBrazilBritish Virgin IslandsBrunei DarussalamBulgariaBurkina FasoBurundiCabo VerdeCambodiaCameroonCanadaCaribbean small statesCayman IslandsCentral African RepublicCentral Europe and the BalticsChadChileChinaColombiaComorosCongo, Dem. Rep.Congo, Rep.Costa RicaCote d'IvoireCroatiaCubaCuracaoCyprusCzech RepublicDenmarkDjiboutiDominicaDominican RepublicEarly-demographic dividendEast Asia & PacificEast Asia & Pacific (excluding high income)East Asia & Pacific (IDA & IBRD countries)EcuadorEgypt, Arab Rep.El SalvadorEquatorial GuineaEritreaEstoniaEthiopiaEuro areaEurope & Central AsiaEurope & Central Asia (excluding high income)Europe & Central Asia (IDA & IBRD countries)European UnionFaroe IslandsFijiFinlandFragile and conflict affected situationsFranceFrench PolynesiaGabonGambia, TheGeorgiaGermanyGhanaGibraltarGreeceGreenlandGrenadaGuatemalaGuineaGuinea-BissauGuyanaHaitiHeavily indebted poor countries (HIPC)High incomeHondurasHong Kong SAR, ChinaHungaryIBRD onlyIcelandIDA & IBRD totalIDA blendIDA onlyIDA totalIndiaIndonesiaIran, Islamic Rep.IraqIrelandIsraelItalyJamaicaJapanJordanKazakhstanKenyaKiribatiKorea, Dem. People’s Rep.Korea, Rep.KuwaitKyrgyz RepublicLao PDRLate-demographic dividendLatin America & Caribbean Latin America & Caribbean (excluding high income)Latin America & the Caribbean (IDA & IBRD countries)LatviaLeast developed countries: UN classificationLebanonLesothoLiberiaLibyaLiechtensteinLithuaniaLow & middle incomeLow incomeLower middle incomeLuxembourgMacao SAR, ChinaMacedonia, FYRMadagascarMalawiMalaysiaMaldivesMaliMaltaMarshall IslandsMauritaniaMauritiusMexicoMicronesia, Fed. Sts.Middle East & North AfricaMiddle East & North Africa (excluding high income)Middle East & North Africa (IDA & IBRD countries)Middle incomeMoldovaMongoliaMontenegroMoroccoMozambiqueMyanmarNamibiaNauruNepalNetherlandsNew CaledoniaNew ZealandNicaraguaNigerNigeriaNorth AmericaNorwayOECD membersOmanOther small statesPacific island small statesPakistanPalauPanamaPapua New GuineaParaguayPeruPhilippinesPolandPortugalPost-demographic dividendPre-demographic dividendQatarRomaniaRussian FederationRwandaSamoaSao Tome and PrincipeSaudi ArabiaSenegalSerbiaSeychellesSierra LeoneSingaporeSint Maarten (Dutch part)Slovak RepublicSloveniaSmall statesSolomon IslandsSomaliaSouth AfricaSouth AsiaSouth Asia (IDA & IBRD)South SudanSpainSri LankaSt. Kitts and NevisSt. LuciaSt. Vincent and the GrenadinesSub-Saharan Africa Sub-Saharan Africa (excluding high income)Sub-Saharan Africa (IDA & IBRD countries)SudanSurinameSwazilandSwedenSwitzerlandSyrian Arab RepublicTajikistanTanzaniaThailandTimor-LesteTogoTongaTrinidad and TobagoTunisiaTurkeyTurkmenistanTurks and Caicos IslandsUgandaUkraineUnited Arab EmiratesUnited KingdomUnited StatesUpper middle incomeUruguayUzbekistanVanuatuVenezuela, RBVietnamWest Bank and GazaWorldYemen, Rep.ZambiaZimbabwe Timeline:
This timeline shows a graph from 1961 to 2014 of Guatemala. No data until 1960. Number of actual observations by date: 54.
Source name:
World Development Indicators
Source organization:
Carbon Dioxide Information Analysis Center, Environmental Sciences Division, Oak Ridge National Laboratory, Tennessee, United States.
Categories, topics:
Climate Change, Environment
Last updated:
apr 23, 2017
Indicators value changes by year
Minimum:
76.863
jan 1, 2011
Maximum:
95.913
jan 1, 1961
At the date of observation
Value
Absolute change
Change from previous value
jan 1, 1961
95.913
+95.913
0.0%
jan 1, 1962
95.573
-0.34
-0.35%
jan 1, 1963
95.756
+0.183
0.19%
jan 1, 1964
94.94
-0.816
-0.85%
jan 1, 1965
94.824
-0.116
-0.12%
jan 1, 1966
94.063
-0.761
-0.8%
jan 1, 1967
94.316
+0.253
0.27%
jan 1, 1968
94.455
+0.139
0.15%
jan 1, 1969
95.89
+1.436
1.52%
jan 1, 1970
95.177
-0.714
-0.74%
jan 1, 1971
95.215
+0.038
0.04%
jan 1, 1972
95.345
+0.13
0.14%
jan 1, 1973
95.129
-0.217
-0.23%
jan 1, 1974
94.757
-0.372
-0.39%
jan 1, 1975
94.982
+0.226
0.24%
jan 1, 1976
94.485
-0.497
-0.52%
jan 1, 1977
93.245
-1.24
-1.31%
jan 1, 1978
93.558
+0.313
0.34%
jan 1, 1979
93.783
+0.226
0.24%
jan 1, 1980
93.906
+0.123
0.13%
jan 1, 1981
93.74
-0.166
-0.18%
jan 1, 1982
92.791
-0.949
-1.01%
jan 1, 1983
91.304
-1.487
-1.6%
jan 1, 1984
91.119
-0.186
-0.2%
jan 1, 1985
92.926
+1.807
1.98%
jan 1, 1986
92.508
-0.418
-0.45%
jan 1, 1987
90.585
-1.923
-2.08%
jan 1, 1988
82.553
-8.032
-8.87%
jan 1, 1989
89.778
+7.225
8.75%
jan 1, 1990
89.206
-0.572
-0.64%
jan 1, 1991
83.273
-5.932
-6.65%
jan 1, 1992
85.414
+2.14
2.57%
jan 1, 1993
88.117
+2.703
3.17%
jan 1, 1994
89.825
+1.708
1.94%
jan 1, 1995
90.938
+1.113
1.24%
jan 1, 1996
91.709
+0.771
0.85%
jan 1, 1997
91.51
-0.199
-0.22%
jan 1, 1998
91.313
-0.198
-0.22%
jan 1, 1999
91.454
+0.141
0.15%
jan 1, 2000
90.595
-0.858
-0.94%
jan 1, 2001
84.393
-6.202
-6.85%
jan 1, 2002
85.645
+1.252
1.48%
jan 1, 2003
81.692
-3.953
-4.62%
jan 1, 2004
81.747
+0.055
0.07%
jan 1, 2005
80.814
-0.933
-1.14%
jan 1, 2006
78.034
-2.78
-3.44%
jan 1, 2007
77.182
-0.852
-1.09%
jan 1, 2008
80.714
+3.533
4.58%
jan 1, 2009
78.601
-2.113
-2.62%
jan 1, 2010
87.098
+8.497
10.81%
jan 1, 2011
76.863
-10.235
-11.75%
jan 1, 2012
76.921
+0.058
0.08%
jan 1, 2013
76.968
+0.047
0.06%
jan 1, 2014
79.666
+2.698
3.51%
Ranking of countries by current statistics by years


Comments: