29
/
en
AIzaSyAYiBZKx7MnpbEhh9jyipgxe19OcubqV5w
April 1, 2024
33287
European Union
EUU
false
2
1
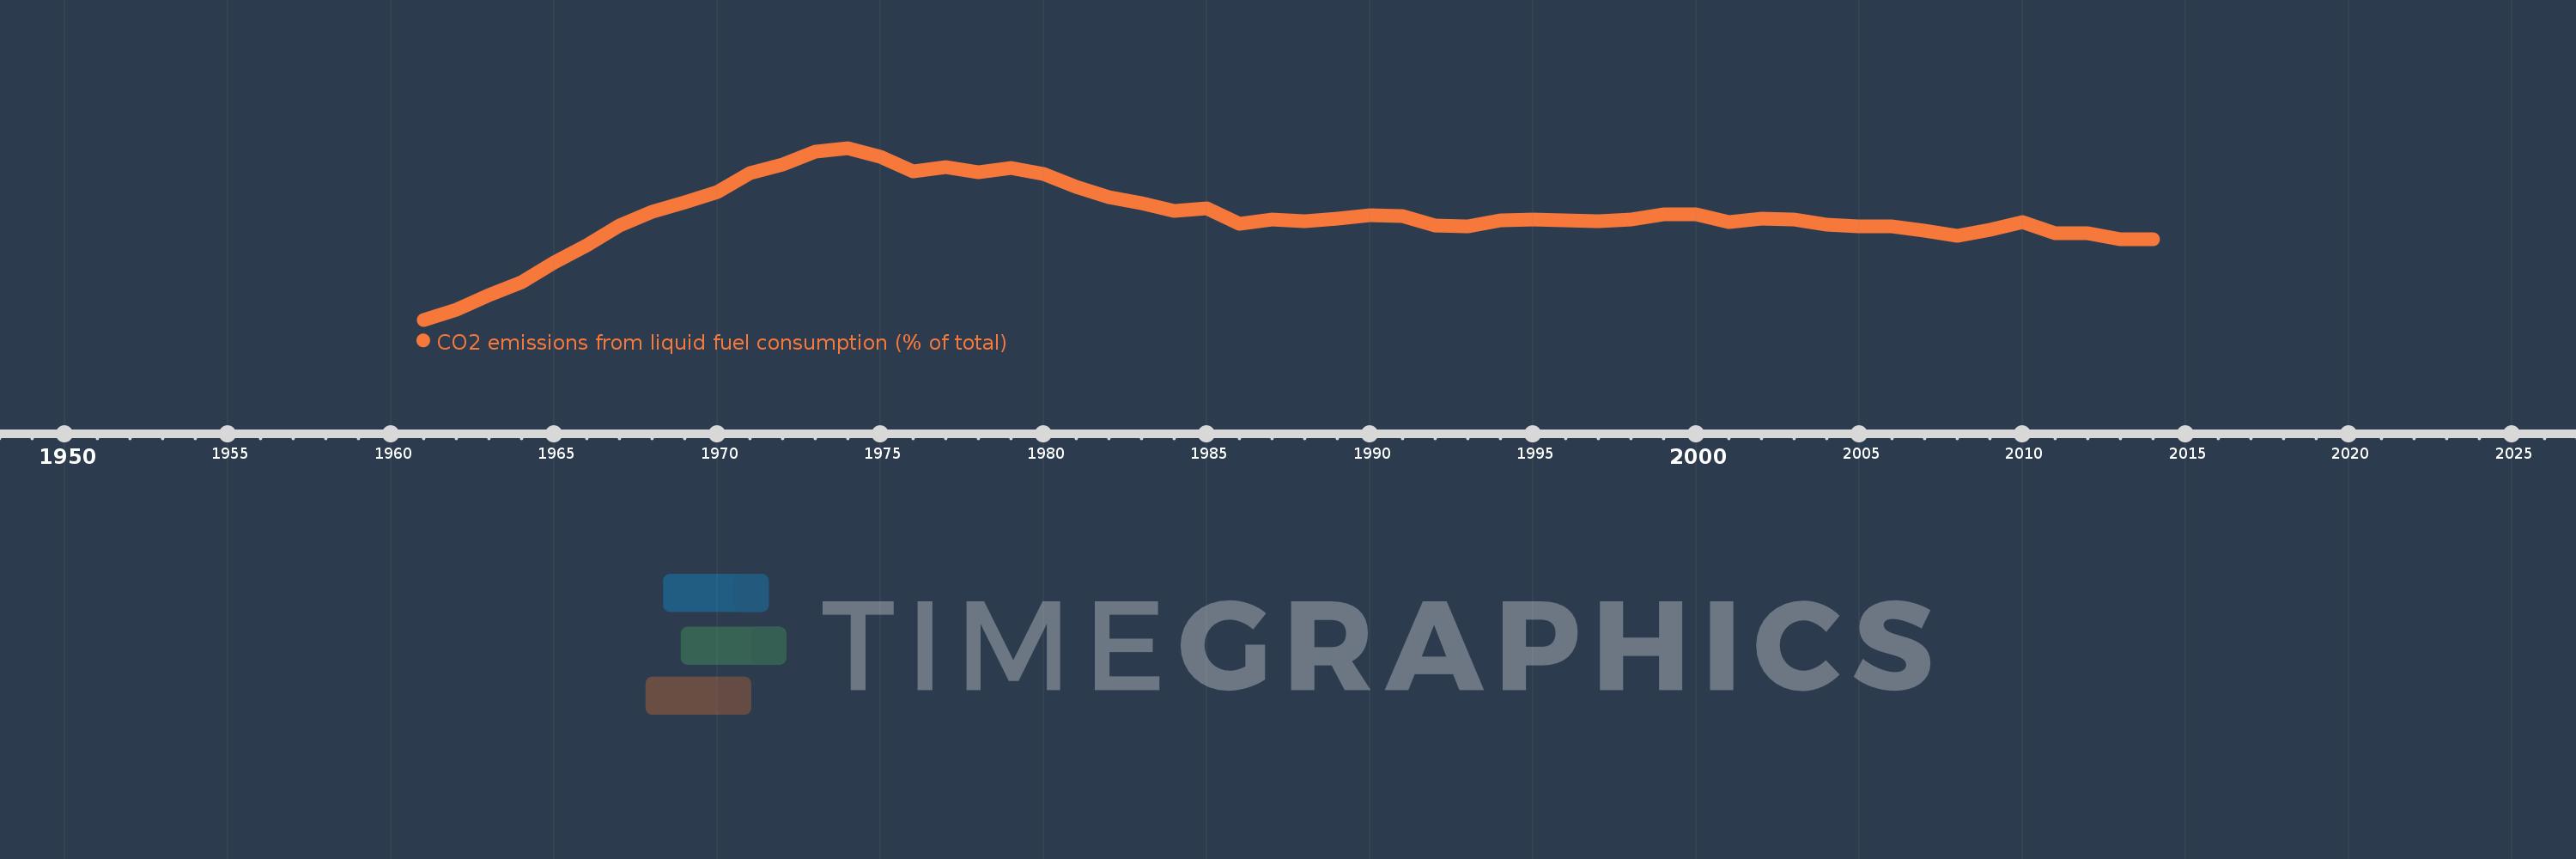
CO2 emissions from liquid fuel consumption (% of total)
2014,2013,2012,2011,2010,2009,2008,2007,2006,2005,2004,2003,2002,2001,2000,1999,1998,1997,1996,1995,1994,1993,1992,1991,1990,1989,1988,1987,1986,1985,1984,1983,1982,1981,1980,1979,1978,1977,1976,1975,1974,1973,1972,1971,1970,1969,1968,1967,1966,1965,1964,1963,1962,1961
This statistics in other country:
AfghanistanAlbaniaAlgeriaAndorraAngolaAntigua and BarbudaArab WorldArgentinaArmeniaArubaAustraliaAustriaAzerbaijanBahamas, TheBahrainBangladeshBarbadosBelarusBelgiumBelizeBeninBermudaBhutanBoliviaBosnia and HerzegovinaBotswanaBrazilBritish Virgin IslandsBrunei DarussalamBulgariaBurkina FasoBurundiCabo VerdeCambodiaCameroonCanadaCaribbean small statesCayman IslandsCentral African RepublicCentral Europe and the BalticsChadChileChinaColombiaComorosCongo, Dem. Rep.Congo, Rep.Costa RicaCote d'IvoireCroatiaCubaCuracaoCyprusCzech RepublicDenmarkDjiboutiDominicaDominican RepublicEarly-demographic dividendEast Asia & PacificEast Asia & Pacific (excluding high income)East Asia & Pacific (IDA & IBRD countries)EcuadorEgypt, Arab Rep.El SalvadorEquatorial GuineaEritreaEstoniaEthiopiaEuro areaEurope & Central AsiaEurope & Central Asia (excluding high income)Europe & Central Asia (IDA & IBRD countries)European UnionFaroe IslandsFijiFinlandFragile and conflict affected situationsFranceFrench PolynesiaGabonGambia, TheGeorgiaGermanyGhanaGibraltarGreeceGreenlandGrenadaGuatemalaGuineaGuinea-BissauGuyanaHaitiHeavily indebted poor countries (HIPC)High incomeHondurasHong Kong SAR, ChinaHungaryIBRD onlyIcelandIDA & IBRD totalIDA blendIDA onlyIDA totalIndiaIndonesiaIran, Islamic Rep.IraqIrelandIsraelItalyJamaicaJapanJordanKazakhstanKenyaKiribatiKorea, Dem. People’s Rep.Korea, Rep.KuwaitKyrgyz RepublicLao PDRLate-demographic dividendLatin America & Caribbean Latin America & Caribbean (excluding high income)Latin America & the Caribbean (IDA & IBRD countries)LatviaLeast developed countries: UN classificationLebanonLesothoLiberiaLibyaLiechtensteinLithuaniaLow & middle incomeLow incomeLower middle incomeLuxembourgMacao SAR, ChinaMacedonia, FYRMadagascarMalawiMalaysiaMaldivesMaliMaltaMarshall IslandsMauritaniaMauritiusMexicoMicronesia, Fed. Sts.Middle East & North AfricaMiddle East & North Africa (excluding high income)Middle East & North Africa (IDA & IBRD countries)Middle incomeMoldovaMongoliaMontenegroMoroccoMozambiqueMyanmarNamibiaNauruNepalNetherlandsNew CaledoniaNew ZealandNicaraguaNigerNigeriaNorth AmericaNorwayOECD membersOmanOther small statesPacific island small statesPakistanPalauPanamaPapua New GuineaParaguayPeruPhilippinesPolandPortugalPost-demographic dividendPre-demographic dividendQatarRomaniaRussian FederationRwandaSamoaSao Tome and PrincipeSaudi ArabiaSenegalSerbiaSeychellesSierra LeoneSingaporeSint Maarten (Dutch part)Slovak RepublicSloveniaSmall statesSolomon IslandsSomaliaSouth AfricaSouth AsiaSouth Asia (IDA & IBRD)South SudanSpainSri LankaSt. Kitts and NevisSt. LuciaSt. Vincent and the GrenadinesSub-Saharan Africa Sub-Saharan Africa (excluding high income)Sub-Saharan Africa (IDA & IBRD countries)SudanSurinameSwazilandSwedenSwitzerlandSyrian Arab RepublicTajikistanTanzaniaThailandTimor-LesteTogoTongaTrinidad and TobagoTunisiaTurkeyTurkmenistanTurks and Caicos IslandsUgandaUkraineUnited Arab EmiratesUnited KingdomUnited StatesUpper middle incomeUruguayUzbekistanVanuatuVenezuela, RBVietnamWest Bank and GazaWorldYemen, Rep.ZambiaZimbabwe Timeline:
This timeline shows a graph from 1961 to 2014 of European Union. No data until 1960. Number of actual observations by date: 54.
Source name:
World Development Indicators
Source organization:
Carbon Dioxide Information Analysis Center, Environmental Sciences Division, Oak Ridge National Laboratory, Tennessee, United States.
Categories, topics:
Climate Change, Environment
Last updated:
apr 23, 2017
Indicators value changes by year
Minimum:
27.008
jan 1, 1961
Maximum:
53.272
jan 1, 1974
At the date of observation
Value
Absolute change
Change from previous value
jan 1, 1961
27.008
+27.008
0.0%
jan 1, 1962
28.544
+1.536
5.69%
jan 1, 1963
30.84
+2.296
8.04%
jan 1, 1964
32.753
+1.913
6.2%
jan 1, 1965
35.798
+3.045
9.3%
jan 1, 1966
38.418
+2.62
7.32%
jan 1, 1967
41.379
+2.961
7.71%
jan 1, 1968
43.469
+2.09
5.05%
jan 1, 1969
44.98
+1.511
3.48%
jan 1, 1970
46.504
+1.524
3.39%
jan 1, 1971
49.405
+2.901
6.24%
jan 1, 1972
50.679
+1.274
2.58%
jan 1, 1973
52.649
+1.97
3.89%
jan 1, 1974
53.272
+0.623
1.18%
jan 1, 1975
51.917
-1.355
-2.54%
jan 1, 1976
49.721
-2.196
-4.23%
jan 1, 1977
50.293
+0.571
1.15%
jan 1, 1978
49.523
-0.769
-1.53%
jan 1, 1979
50.185
+0.662
1.34%
jan 1, 1980
49.353
-0.832
-1.66%
jan 1, 1981
47.349
-2.004
-4.06%
jan 1, 1982
45.778
-1.571
-3.32%
jan 1, 1983
44.783
-0.995
-2.17%
jan 1, 1984
43.607
-1.176
-2.63%
jan 1, 1985
44.069
+0.462
1.06%
jan 1, 1986
41.69
-2.378
-5.4%
jan 1, 1987
42.382
+0.692
1.66%
jan 1, 1988
42.043
-0.339
-0.8%
jan 1, 1989
42.527
+0.484
1.15%
jan 1, 1990
42.934
+0.407
0.96%
jan 1, 1991
42.814
-0.119
-0.28%
jan 1, 1992
41.443
-1.371
-3.2%
jan 1, 1993
41.272
-0.172
-0.41%
jan 1, 1994
42.211
+0.939
2.28%
jan 1, 1995
42.331
+0.12
0.28%
jan 1, 1996
42.23
-0.1
-0.24%
jan 1, 1997
42.03
-0.2
-0.47%
jan 1, 1998
42.396
+0.366
0.87%
jan 1, 1999
43.172
+0.776
1.83%
jan 1, 2000
43.181
+0.009
0.02%
jan 1, 2001
42.002
-1.179
-2.73%
jan 1, 2002
42.426
+0.424
1.01%
jan 1, 2003
42.357
-0.068
-0.16%
jan 1, 2004
41.566
-0.791
-1.87%
jan 1, 2005
41.316
-0.25
-0.6%
jan 1, 2006
41.242
-0.074
-0.18%
jan 1, 2007
40.577
-0.664
-1.61%
jan 1, 2008
39.9
-0.678
-1.67%
jan 1, 2009
40.729
+0.83
2.08%
jan 1, 2010
41.977
+1.248
3.06%
jan 1, 2011
40.246
-1.731
-4.12%
jan 1, 2012
40.264
+0.018
0.04%
jan 1, 2013
39.366
-0.898
-2.23%
jan 1, 2014
39.27
-0.096
-0.24%
Ranking of countries by current statistics by years


Comments: