29
/
en
AIzaSyAYiBZKx7MnpbEhh9jyipgxe19OcubqV5w
April 1, 2024
260630
Tanzania
TZA
true
2
1
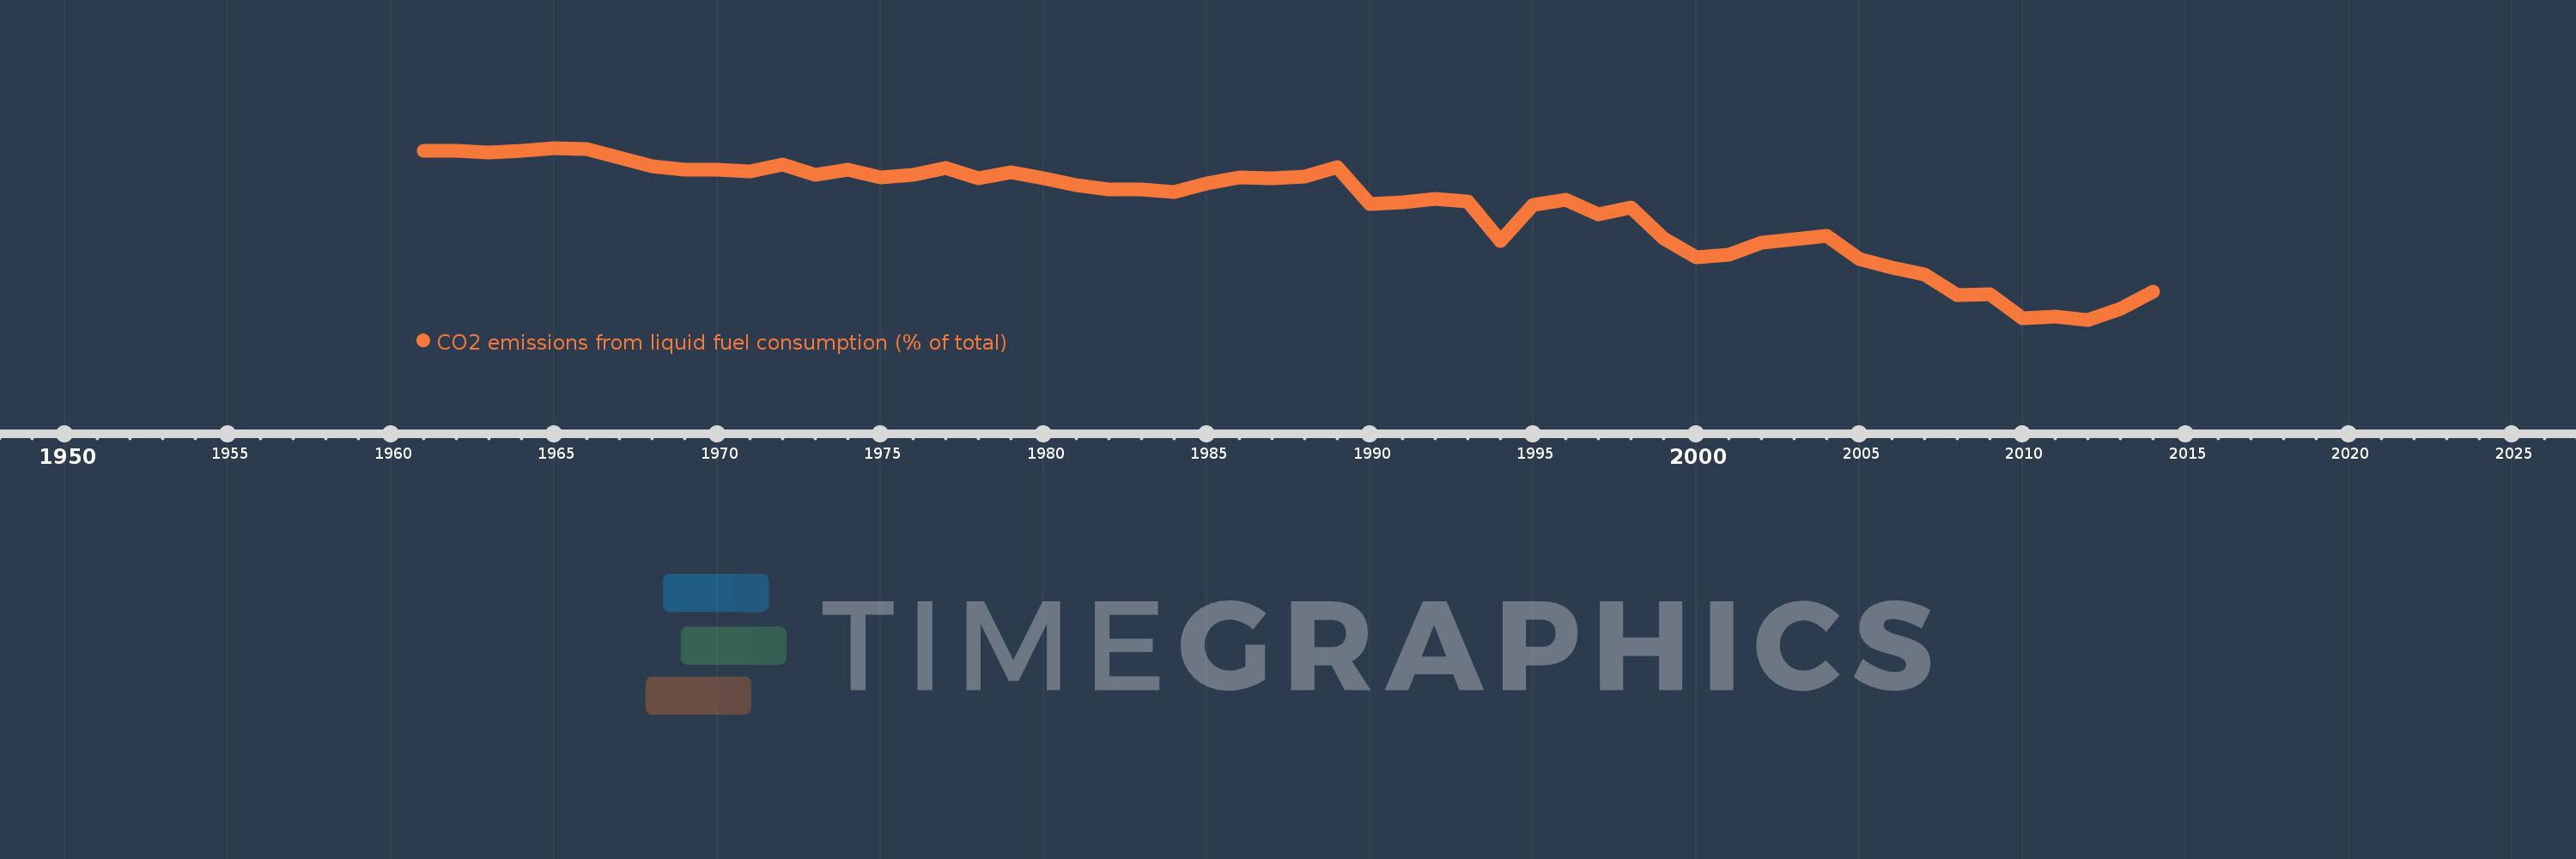
CO2 emissions from liquid fuel consumption (% of total)
2014,2013,2012,2011,2010,2009,2008,2007,2006,2005,2004,2003,2002,2001,2000,1999,1998,1997,1996,1995,1994,1993,1992,1991,1990,1989,1988,1987,1986,1985,1984,1983,1982,1981,1980,1979,1978,1977,1976,1975,1974,1973,1972,1971,1970,1969,1968,1967,1966,1965,1964,1963,1962,1961
This statistics in other country:
AfghanistanAlbaniaAlgeriaAndorraAngolaAntigua and BarbudaArab WorldArgentinaArmeniaArubaAustraliaAustriaAzerbaijanBahamas, TheBahrainBangladeshBarbadosBelarusBelgiumBelizeBeninBermudaBhutanBoliviaBosnia and HerzegovinaBotswanaBrazilBritish Virgin IslandsBrunei DarussalamBulgariaBurkina FasoBurundiCabo VerdeCambodiaCameroonCanadaCaribbean small statesCayman IslandsCentral African RepublicCentral Europe and the BalticsChadChileChinaColombiaComorosCongo, Dem. Rep.Congo, Rep.Costa RicaCote d'IvoireCroatiaCubaCuracaoCyprusCzech RepublicDenmarkDjiboutiDominicaDominican RepublicEarly-demographic dividendEast Asia & PacificEast Asia & Pacific (excluding high income)East Asia & Pacific (IDA & IBRD countries)EcuadorEgypt, Arab Rep.El SalvadorEquatorial GuineaEritreaEstoniaEthiopiaEuro areaEurope & Central AsiaEurope & Central Asia (excluding high income)Europe & Central Asia (IDA & IBRD countries)European UnionFaroe IslandsFijiFinlandFragile and conflict affected situationsFranceFrench PolynesiaGabonGambia, TheGeorgiaGermanyGhanaGibraltarGreeceGreenlandGrenadaGuatemalaGuineaGuinea-BissauGuyanaHaitiHeavily indebted poor countries (HIPC)High incomeHondurasHong Kong SAR, ChinaHungaryIBRD onlyIcelandIDA & IBRD totalIDA blendIDA onlyIDA totalIndiaIndonesiaIran, Islamic Rep.IraqIrelandIsraelItalyJamaicaJapanJordanKazakhstanKenyaKiribatiKorea, Dem. People’s Rep.Korea, Rep.KuwaitKyrgyz RepublicLao PDRLate-demographic dividendLatin America & Caribbean Latin America & Caribbean (excluding high income)Latin America & the Caribbean (IDA & IBRD countries)LatviaLeast developed countries: UN classificationLebanonLesothoLiberiaLibyaLiechtensteinLithuaniaLow & middle incomeLow incomeLower middle incomeLuxembourgMacao SAR, ChinaMacedonia, FYRMadagascarMalawiMalaysiaMaldivesMaliMaltaMarshall IslandsMauritaniaMauritiusMexicoMicronesia, Fed. Sts.Middle East & North AfricaMiddle East & North Africa (excluding high income)Middle East & North Africa (IDA & IBRD countries)Middle incomeMoldovaMongoliaMontenegroMoroccoMozambiqueMyanmarNamibiaNauruNepalNetherlandsNew CaledoniaNew ZealandNicaraguaNigerNigeriaNorth AmericaNorwayOECD membersOmanOther small statesPacific island small statesPakistanPalauPanamaPapua New GuineaParaguayPeruPhilippinesPolandPortugalPost-demographic dividendPre-demographic dividendQatarRomaniaRussian FederationRwandaSamoaSao Tome and PrincipeSaudi ArabiaSenegalSerbiaSeychellesSierra LeoneSingaporeSint Maarten (Dutch part)Slovak RepublicSloveniaSmall statesSolomon IslandsSomaliaSouth AfricaSouth AsiaSouth Asia (IDA & IBRD)South SudanSpainSri LankaSt. Kitts and NevisSt. LuciaSt. Vincent and the GrenadinesSub-Saharan Africa Sub-Saharan Africa (excluding high income)Sub-Saharan Africa (IDA & IBRD countries)SudanSurinameSwazilandSwedenSwitzerlandSyrian Arab RepublicTajikistanTanzaniaThailandTimor-LesteTogoTongaTrinidad and TobagoTunisiaTurkeyTurkmenistanTurks and Caicos IslandsUgandaUkraineUnited Arab EmiratesUnited KingdomUnited StatesUpper middle incomeUruguayUzbekistanVanuatuVenezuela, RBVietnamWest Bank and GazaWorldYemen, Rep.ZambiaZimbabwe Timeline:
This timeline shows a graph from 1961 to 2014 of Tanzania. No data until 1960. Number of actual observations by date: 54.
Source name:
World Development Indicators
Source organization:
Carbon Dioxide Information Analysis Center, Environmental Sciences Division, Oak Ridge National Laboratory, Tennessee, United States.
Categories, topics:
Climate Change, Environment
Last updated:
apr 23, 2017
Indicators value changes by year
Minimum:
62.347
jan 1, 2012
Maximum:
99.645
jan 1, 1965
At the date of observation
Value
Absolute change
Change from previous value
jan 1, 1961
99.115
+99.115
0.0%
jan 1, 1962
98.958
-0.157
-0.16%
jan 1, 1963
98.565
-0.394
-0.4%
jan 1, 1964
99.087
+0.522
0.53%
jan 1, 1965
99.645
+0.559
0.56%
jan 1, 1966
99.369
-0.276
-0.28%
jan 1, 1967
97.594
-1.776
-1.79%
jan 1, 1968
95.625
-1.969
-2.02%
jan 1, 1969
94.9
-0.725
-0.76%
jan 1, 1970
94.898
-0.002
0.0%
jan 1, 1971
94.606
-0.292
-0.31%
jan 1, 1972
95.982
+1.376
1.45%
jan 1, 1973
93.739
-2.243
-2.34%
jan 1, 1974
94.937
+1.197
1.28%
jan 1, 1975
93.323
-1.614
-1.7%
jan 1, 1976
93.9
+0.578
0.62%
jan 1, 1977
95.269
+1.369
1.46%
jan 1, 1978
93.078
-2.191
-2.3%
jan 1, 1979
94.343
+1.264
1.36%
jan 1, 1980
93.097
-1.245
-1.32%
jan 1, 1981
91.634
-1.463
-1.57%
jan 1, 1982
90.674
-0.961
-1.05%
jan 1, 1983
90.694
+0.02
0.02%
jan 1, 1984
90.083
-0.611
-0.67%
jan 1, 1985
91.95
+1.868
2.07%
jan 1, 1986
93.157
+1.207
1.31%
jan 1, 1987
92.982
-0.175
-0.19%
jan 1, 1988
93.405
+0.422
0.45%
jan 1, 1989
95.513
+2.108
2.26%
jan 1, 1990
87.542
-7.971
-8.35%
jan 1, 1991
87.864
+0.323
0.37%
jan 1, 1992
88.532
+0.668
0.76%
jan 1, 1993
88.013
-0.519
-0.59%
jan 1, 1994
79.52
-8.493
-9.65%
jan 1, 1995
87.348
+7.828
9.84%
jan 1, 1996
88.442
+1.094
1.25%
jan 1, 1997
85.169
-3.272
-3.7%
jan 1, 1998
86.768
+1.599
1.88%
jan 1, 1999
80.057
-6.711
-7.73%
jan 1, 2000
75.867
-4.19
-5.23%
jan 1, 2001
76.487
+0.62
0.82%
jan 1, 2002
79.132
+2.646
3.46%
jan 1, 2003
79.877
+0.745
0.94%
jan 1, 2004
80.636
+0.758
0.95%
jan 1, 2005
75.546
-5.09
-6.31%
jan 1, 2006
73.751
-1.795
-2.38%
jan 1, 2007
72.141
-1.61
-2.18%
jan 1, 2008
67.662
-4.479
-6.21%
jan 1, 2009
67.881
+0.219
0.32%
jan 1, 2010
62.577
-5.303
-7.81%
jan 1, 2011
63.055
+0.477
0.76%
jan 1, 2012
62.347
-0.708
-1.12%
jan 1, 2013
64.771
+2.424
3.89%
jan 1, 2014
68.417
+3.646
5.63%
Ranking of countries by current statistics by years


Comments: