29
/
en
AIzaSyAYiBZKx7MnpbEhh9jyipgxe19OcubqV5w
April 1, 2024
133912
France
FRA
true
2
1
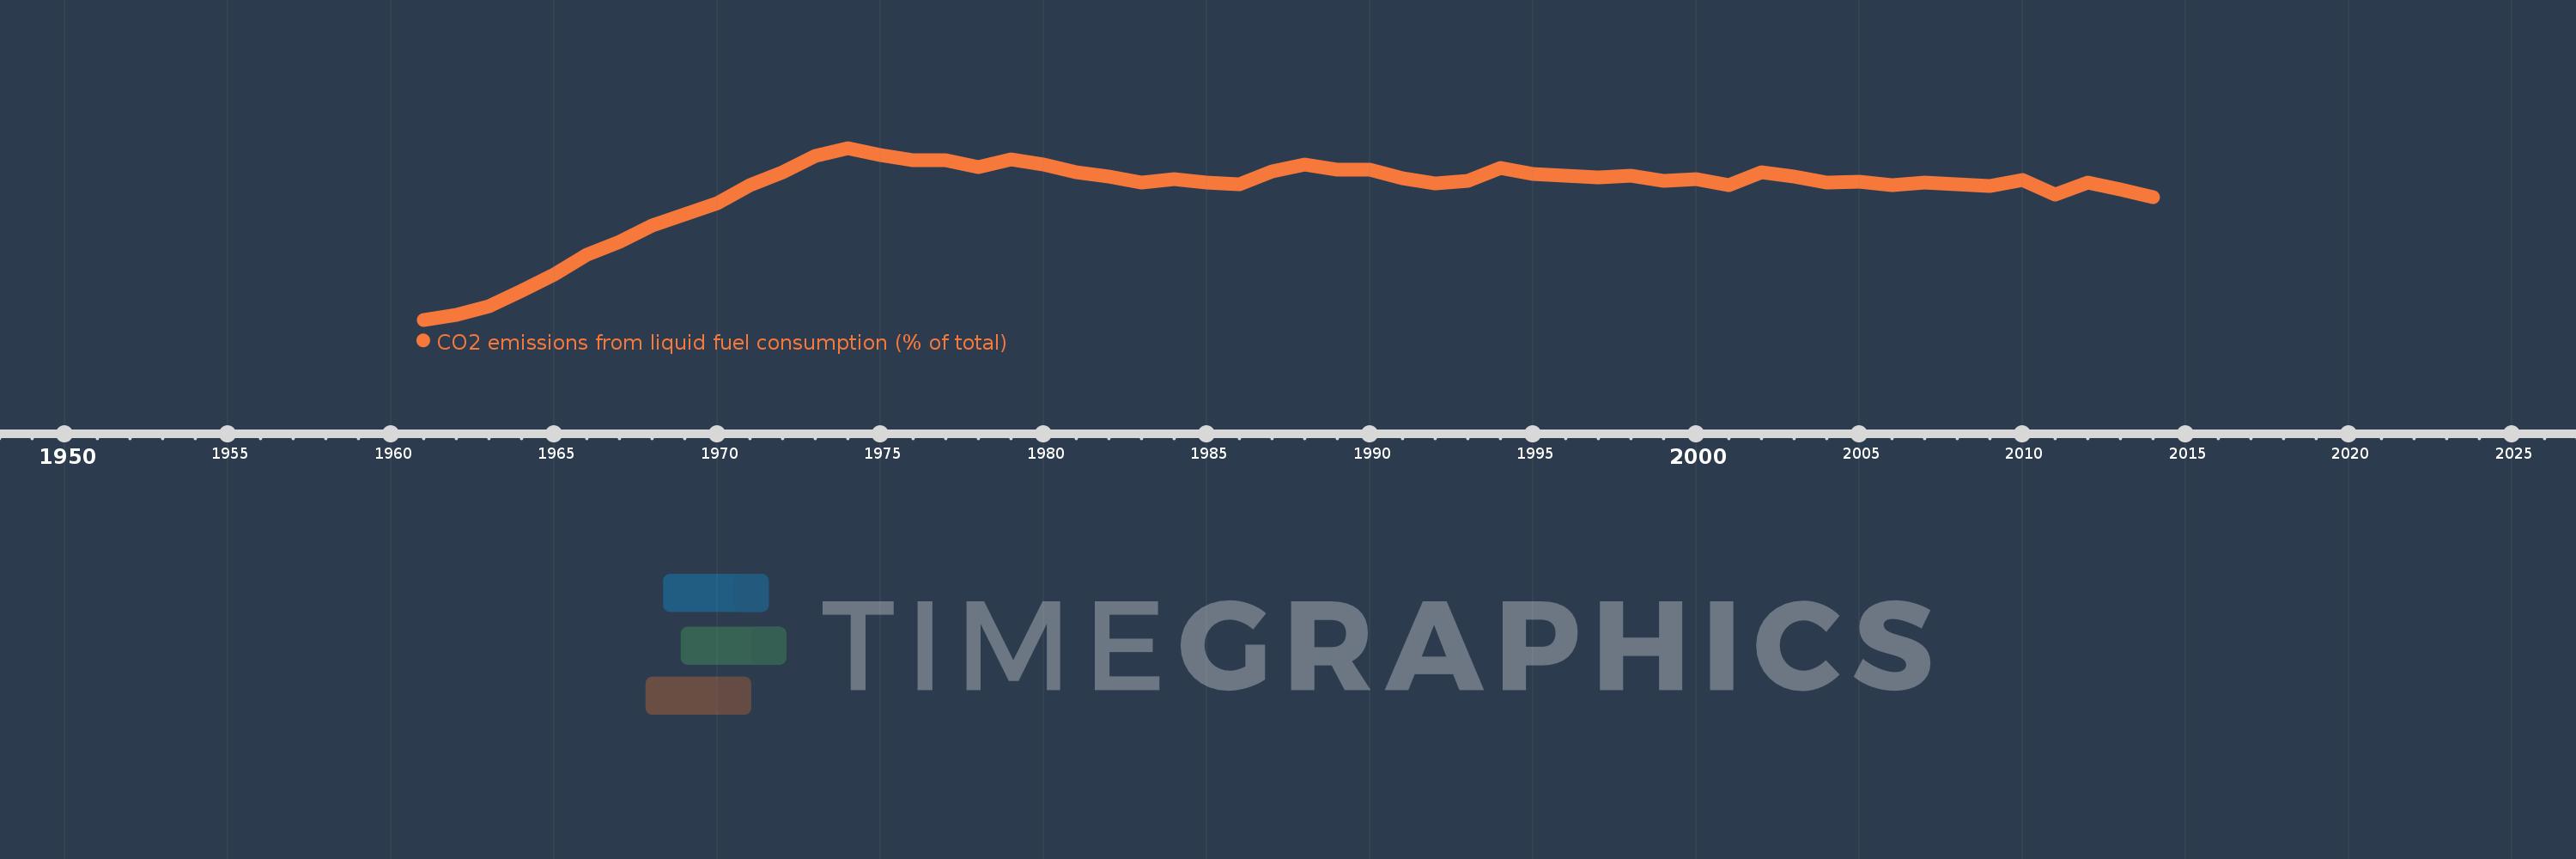
CO2 emissions from liquid fuel consumption (% of total)
2014,2013,2012,2011,2010,2009,2008,2007,2006,2005,2004,2003,2002,2001,2000,1999,1998,1997,1996,1995,1994,1993,1992,1991,1990,1989,1988,1987,1986,1985,1984,1983,1982,1981,1980,1979,1978,1977,1976,1975,1974,1973,1972,1971,1970,1969,1968,1967,1966,1965,1964,1963,1962,1961
This statistics in other country:
AfghanistanAlbaniaAlgeriaAndorraAngolaAntigua and BarbudaArab WorldArgentinaArmeniaArubaAustraliaAustriaAzerbaijanBahamas, TheBahrainBangladeshBarbadosBelarusBelgiumBelizeBeninBermudaBhutanBoliviaBosnia and HerzegovinaBotswanaBrazilBritish Virgin IslandsBrunei DarussalamBulgariaBurkina FasoBurundiCabo VerdeCambodiaCameroonCanadaCaribbean small statesCayman IslandsCentral African RepublicCentral Europe and the BalticsChadChileChinaColombiaComorosCongo, Dem. Rep.Congo, Rep.Costa RicaCote d'IvoireCroatiaCubaCuracaoCyprusCzech RepublicDenmarkDjiboutiDominicaDominican RepublicEarly-demographic dividendEast Asia & PacificEast Asia & Pacific (excluding high income)East Asia & Pacific (IDA & IBRD countries)EcuadorEgypt, Arab Rep.El SalvadorEquatorial GuineaEritreaEstoniaEthiopiaEuro areaEurope & Central AsiaEurope & Central Asia (excluding high income)Europe & Central Asia (IDA & IBRD countries)European UnionFaroe IslandsFijiFinlandFragile and conflict affected situationsFranceFrench PolynesiaGabonGambia, TheGeorgiaGermanyGhanaGibraltarGreeceGreenlandGrenadaGuatemalaGuineaGuinea-BissauGuyanaHaitiHeavily indebted poor countries (HIPC)High incomeHondurasHong Kong SAR, ChinaHungaryIBRD onlyIcelandIDA & IBRD totalIDA blendIDA onlyIDA totalIndiaIndonesiaIran, Islamic Rep.IraqIrelandIsraelItalyJamaicaJapanJordanKazakhstanKenyaKiribatiKorea, Dem. People’s Rep.Korea, Rep.KuwaitKyrgyz RepublicLao PDRLate-demographic dividendLatin America & Caribbean Latin America & Caribbean (excluding high income)Latin America & the Caribbean (IDA & IBRD countries)LatviaLeast developed countries: UN classificationLebanonLesothoLiberiaLibyaLiechtensteinLithuaniaLow & middle incomeLow incomeLower middle incomeLuxembourgMacao SAR, ChinaMacedonia, FYRMadagascarMalawiMalaysiaMaldivesMaliMaltaMarshall IslandsMauritaniaMauritiusMexicoMicronesia, Fed. Sts.Middle East & North AfricaMiddle East & North Africa (excluding high income)Middle East & North Africa (IDA & IBRD countries)Middle incomeMoldovaMongoliaMontenegroMoroccoMozambiqueMyanmarNamibiaNauruNepalNetherlandsNew CaledoniaNew ZealandNicaraguaNigerNigeriaNorth AmericaNorwayOECD membersOmanOther small statesPacific island small statesPakistanPalauPanamaPapua New GuineaParaguayPeruPhilippinesPolandPortugalPost-demographic dividendPre-demographic dividendQatarRomaniaRussian FederationRwandaSamoaSao Tome and PrincipeSaudi ArabiaSenegalSerbiaSeychellesSierra LeoneSingaporeSint Maarten (Dutch part)Slovak RepublicSloveniaSmall statesSolomon IslandsSomaliaSouth AfricaSouth AsiaSouth Asia (IDA & IBRD)South SudanSpainSri LankaSt. Kitts and NevisSt. LuciaSt. Vincent and the GrenadinesSub-Saharan Africa Sub-Saharan Africa (excluding high income)Sub-Saharan Africa (IDA & IBRD countries)SudanSurinameSwazilandSwedenSwitzerlandSyrian Arab RepublicTajikistanTanzaniaThailandTimor-LesteTogoTongaTrinidad and TobagoTunisiaTurkeyTurkmenistanTurks and Caicos IslandsUgandaUkraineUnited Arab EmiratesUnited KingdomUnited StatesUpper middle incomeUruguayUzbekistanVanuatuVenezuela, RBVietnamWest Bank and GazaWorldYemen, Rep.ZambiaZimbabwe Timeline:
This timeline shows a graph from 1961 to 2014 of France. No data until 1960. Number of actual observations by date: 54.
Source name:
World Development Indicators
Source organization:
Carbon Dioxide Information Analysis Center, Environmental Sciences Division, Oak Ridge National Laboratory, Tennessee, United States.
Categories, topics:
Climate Change, Environment
Last updated:
apr 23, 2017
Indicators value changes by year
Minimum:
28.563
jan 1, 1961
At the date of observation
Value
Absolute change
Change from previous value
jan 1, 1961
28.563
+28.563
0.0%
jan 1, 1962
29.774
+1.211
4.24%
jan 1, 1963
31.637
+1.863
6.26%
jan 1, 1964
35.24
+3.602
11.39%
jan 1, 1965
38.831
+3.591
10.19%
jan 1, 1966
43.297
+4.466
11.5%
jan 1, 1967
46.197
+2.9
6.7%
jan 1, 1968
49.926
+3.729
8.07%
jan 1, 1969
52.592
+2.666
5.34%
jan 1, 1970
55.009
+2.416
4.59%
jan 1, 1971
59.125
+4.117
7.48%
jan 1, 1972
62.113
+2.988
5.05%
jan 1, 1973
65.83
+3.716
5.98%
jan 1, 1974
67.65
+1.82
2.77%
jan 1, 1975
66.091
-1.559
-2.31%
jan 1, 1976
64.9
-1.19
-1.8%
jan 1, 1977
64.81
-0.091
-0.14%
jan 1, 1978
63.348
-1.462
-2.26%
jan 1, 1979
64.996
+1.648
2.6%
jan 1, 1980
63.786
-1.21
-1.86%
jan 1, 1981
62.069
-1.717
-2.69%
jan 1, 1982
61.224
-0.846
-1.36%
jan 1, 1983
59.776
-1.448
-2.36%
jan 1, 1984
60.626
+0.85
1.42%
jan 1, 1985
59.792
-0.834
-1.37%
jan 1, 1986
59.291
-0.502
-0.84%
jan 1, 1987
62.234
+2.943
4.96%
jan 1, 1988
63.833
+1.599
2.57%
jan 1, 1989
62.768
-1.065
-1.67%
jan 1, 1990
62.668
-0.1
-0.16%
jan 1, 1991
60.668
-2.0
-3.19%
jan 1, 1992
59.609
-1.06
-1.75%
jan 1, 1993
60.25
+0.641
1.08%
jan 1, 1994
63.149
+2.899
4.81%
jan 1, 1995
61.706
-1.443
-2.29%
jan 1, 1996
61.308
-0.398
-0.64%
jan 1, 1997
60.929
-0.378
-0.62%
jan 1, 1998
61.291
+0.362
0.59%
jan 1, 1999
60.113
-1.178
-1.92%
jan 1, 2000
60.532
+0.419
0.7%
jan 1, 2001
59.252
-1.28
-2.11%
jan 1, 2002
62.098
+2.846
4.8%
jan 1, 2003
61.061
-1.037
-1.67%
jan 1, 2004
59.751
-1.31
-2.14%
jan 1, 2005
59.985
+0.234
0.39%
jan 1, 2006
59.136
-0.849
-1.41%
jan 1, 2007
59.795
+0.658
1.11%
jan 1, 2008
59.328
-0.467
-0.78%
jan 1, 2009
58.971
-0.356
-0.6%
jan 1, 2010
60.404
+1.433
2.43%
jan 1, 2011
57.055
-3.349
-5.55%
jan 1, 2012
59.851
+2.797
4.9%
jan 1, 2013
58.216
-1.635
-2.73%
jan 1, 2014
56.532
-1.684
-2.89%
Ranking of countries by current statistics by years


Comments: