29
/
en
AIzaSyAYiBZKx7MnpbEhh9jyipgxe19OcubqV5w
April 1, 2024
181904
Luxembourg
LUX
true
2
1
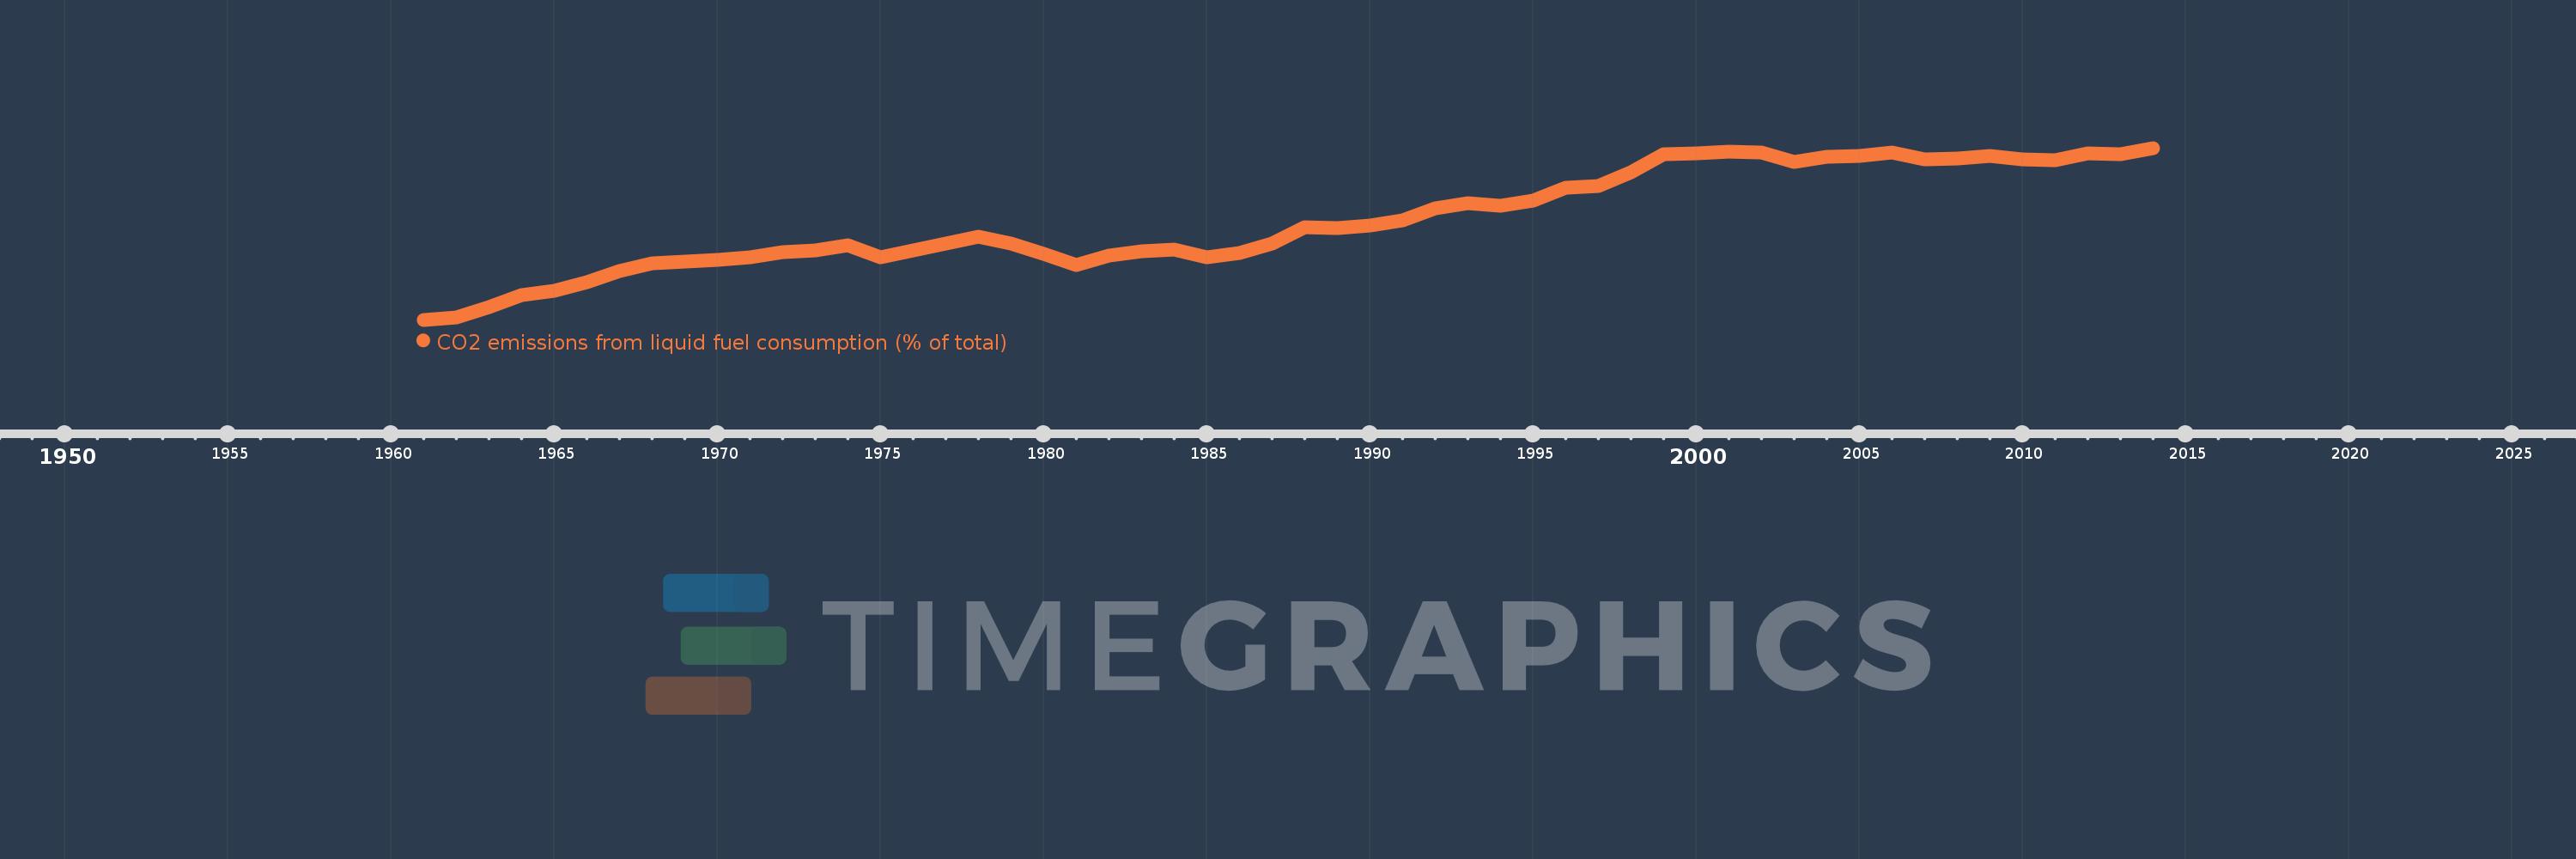
CO2 emissions from liquid fuel consumption (% of total)
2014,2013,2012,2011,2010,2009,2008,2007,2006,2005,2004,2003,2002,2001,2000,1999,1998,1997,1996,1995,1994,1993,1992,1991,1990,1989,1988,1987,1986,1985,1984,1983,1982,1981,1980,1979,1978,1977,1976,1975,1974,1973,1972,1971,1970,1969,1968,1967,1966,1965,1964,1963,1962,1961
This statistics in other country:
AfghanistanAlbaniaAlgeriaAndorraAngolaAntigua and BarbudaArab WorldArgentinaArmeniaArubaAustraliaAustriaAzerbaijanBahamas, TheBahrainBangladeshBarbadosBelarusBelgiumBelizeBeninBermudaBhutanBoliviaBosnia and HerzegovinaBotswanaBrazilBritish Virgin IslandsBrunei DarussalamBulgariaBurkina FasoBurundiCabo VerdeCambodiaCameroonCanadaCaribbean small statesCayman IslandsCentral African RepublicCentral Europe and the BalticsChadChileChinaColombiaComorosCongo, Dem. Rep.Congo, Rep.Costa RicaCote d'IvoireCroatiaCubaCuracaoCyprusCzech RepublicDenmarkDjiboutiDominicaDominican RepublicEarly-demographic dividendEast Asia & PacificEast Asia & Pacific (excluding high income)East Asia & Pacific (IDA & IBRD countries)EcuadorEgypt, Arab Rep.El SalvadorEquatorial GuineaEritreaEstoniaEthiopiaEuro areaEurope & Central AsiaEurope & Central Asia (excluding high income)Europe & Central Asia (IDA & IBRD countries)European UnionFaroe IslandsFijiFinlandFragile and conflict affected situationsFranceFrench PolynesiaGabonGambia, TheGeorgiaGermanyGhanaGibraltarGreeceGreenlandGrenadaGuatemalaGuineaGuinea-BissauGuyanaHaitiHeavily indebted poor countries (HIPC)High incomeHondurasHong Kong SAR, ChinaHungaryIBRD onlyIcelandIDA & IBRD totalIDA blendIDA onlyIDA totalIndiaIndonesiaIran, Islamic Rep.IraqIrelandIsraelItalyJamaicaJapanJordanKazakhstanKenyaKiribatiKorea, Dem. People’s Rep.Korea, Rep.KuwaitKyrgyz RepublicLao PDRLate-demographic dividendLatin America & Caribbean Latin America & Caribbean (excluding high income)Latin America & the Caribbean (IDA & IBRD countries)LatviaLeast developed countries: UN classificationLebanonLesothoLiberiaLibyaLiechtensteinLithuaniaLow & middle incomeLow incomeLower middle incomeLuxembourgMacao SAR, ChinaMacedonia, FYRMadagascarMalawiMalaysiaMaldivesMaliMaltaMarshall IslandsMauritaniaMauritiusMexicoMicronesia, Fed. Sts.Middle East & North AfricaMiddle East & North Africa (excluding high income)Middle East & North Africa (IDA & IBRD countries)Middle incomeMoldovaMongoliaMontenegroMoroccoMozambiqueMyanmarNamibiaNauruNepalNetherlandsNew CaledoniaNew ZealandNicaraguaNigerNigeriaNorth AmericaNorwayOECD membersOmanOther small statesPacific island small statesPakistanPalauPanamaPapua New GuineaParaguayPeruPhilippinesPolandPortugalPost-demographic dividendPre-demographic dividendQatarRomaniaRussian FederationRwandaSamoaSao Tome and PrincipeSaudi ArabiaSenegalSerbiaSeychellesSierra LeoneSingaporeSint Maarten (Dutch part)Slovak RepublicSloveniaSmall statesSolomon IslandsSomaliaSouth AfricaSouth AsiaSouth Asia (IDA & IBRD)South SudanSpainSri LankaSt. Kitts and NevisSt. LuciaSt. Vincent and the GrenadinesSub-Saharan Africa Sub-Saharan Africa (excluding high income)Sub-Saharan Africa (IDA & IBRD countries)SudanSurinameSwazilandSwedenSwitzerlandSyrian Arab RepublicTajikistanTanzaniaThailandTimor-LesteTogoTongaTrinidad and TobagoTunisiaTurkeyTurkmenistanTurks and Caicos IslandsUgandaUkraineUnited Arab EmiratesUnited KingdomUnited StatesUpper middle incomeUruguayUzbekistanVanuatuVenezuela, RBVietnamWest Bank and GazaWorldYemen, Rep.ZambiaZimbabwe Timeline:
This timeline shows a graph from 1961 to 2014 of Luxembourg. No data until 1960. Number of actual observations by date: 54.
Source name:
World Development Indicators
Source organization:
Carbon Dioxide Information Analysis Center, Environmental Sciences Division, Oak Ridge National Laboratory, Tennessee, United States.
Categories, topics:
Climate Change, Environment
Last updated:
apr 23, 2017
Indicators value changes by year
At the date of observation
Value
Absolute change
Change from previous value
jan 1, 1961
5.635
+5.635
0.0%
jan 1, 1962
6.675
+1.04
18.45%
jan 1, 1963
10.381
+3.706
55.52%
jan 1, 1964
15.086
+4.706
45.33%
jan 1, 1965
16.895
+1.809
11.99%
jan 1, 1966
20.313
+3.417
20.23%
jan 1, 1967
24.393
+4.08
20.09%
jan 1, 1968
27.631
+3.238
13.28%
jan 1, 1969
28.213
+0.582
2.11%
jan 1, 1970
28.933
+0.72
2.55%
jan 1, 1971
29.715
+0.782
2.7%
jan 1, 1972
31.861
+2.147
7.22%
jan 1, 1973
32.582
+0.72
2.26%
jan 1, 1974
34.55
+1.968
6.04%
jan 1, 1975
30.0
-4.55
-13.17%
jan 1, 1976
32.693
+2.693
8.98%
jan 1, 1977
35.181
+2.488
7.61%
jan 1, 1978
37.886
+2.705
7.69%
jan 1, 1979
35.283
-2.603
-6.87%
jan 1, 1980
31.186
-4.097
-11.61%
jan 1, 1981
27.004
-4.182
-13.41%
jan 1, 1982
30.494
+3.49
12.93%
jan 1, 1983
32.202
+1.708
5.6%
jan 1, 1984
32.95
+0.748
2.32%
jan 1, 1985
29.938
-3.012
-9.14%
jan 1, 1986
31.56
+1.622
5.42%
jan 1, 1987
35.124
+3.564
11.29%
jan 1, 1988
41.54
+6.416
18.27%
jan 1, 1989
41.191
-0.349
-0.84%
jan 1, 1990
42.255
+1.064
2.58%
jan 1, 1991
44.062
+1.806
4.28%
jan 1, 1992
48.946
+4.885
11.09%
jan 1, 1993
50.85
+1.903
3.89%
jan 1, 1994
49.898
-0.952
-1.87%
jan 1, 1995
51.853
+1.955
3.92%
jan 1, 1996
56.966
+5.113
9.86%
jan 1, 1997
57.627
+0.661
1.16%
jan 1, 1998
62.725
+5.098
8.85%
jan 1, 1999
69.791
+7.065
11.26%
jan 1, 2000
70.086
+0.295
0.42%
jan 1, 2001
71.028
+0.942
1.34%
jan 1, 2002
70.542
-0.486
-0.68%
jan 1, 2003
66.861
-3.68
-5.22%
jan 1, 2004
68.974
+2.113
3.16%
jan 1, 2005
69.053
+0.079
0.11%
jan 1, 2006
70.499
+1.446
2.09%
jan 1, 2007
67.722
-2.776
-3.94%
jan 1, 2008
68.286
+0.564
0.83%
jan 1, 2009
69.259
+0.973
1.42%
jan 1, 2010
67.925
-1.334
-1.93%
jan 1, 2011
67.503
-0.423
-0.62%
jan 1, 2012
70.365
+2.863
4.24%
jan 1, 2013
70.014
-0.352
-0.5%
jan 1, 2014
72.32
+2.307
3.29%
Ranking of countries by current statistics by years


Comments: