29
/
en
AIzaSyAYiBZKx7MnpbEhh9jyipgxe19OcubqV5w
April 1, 2024
271997
Uganda
UGA
true
2
1
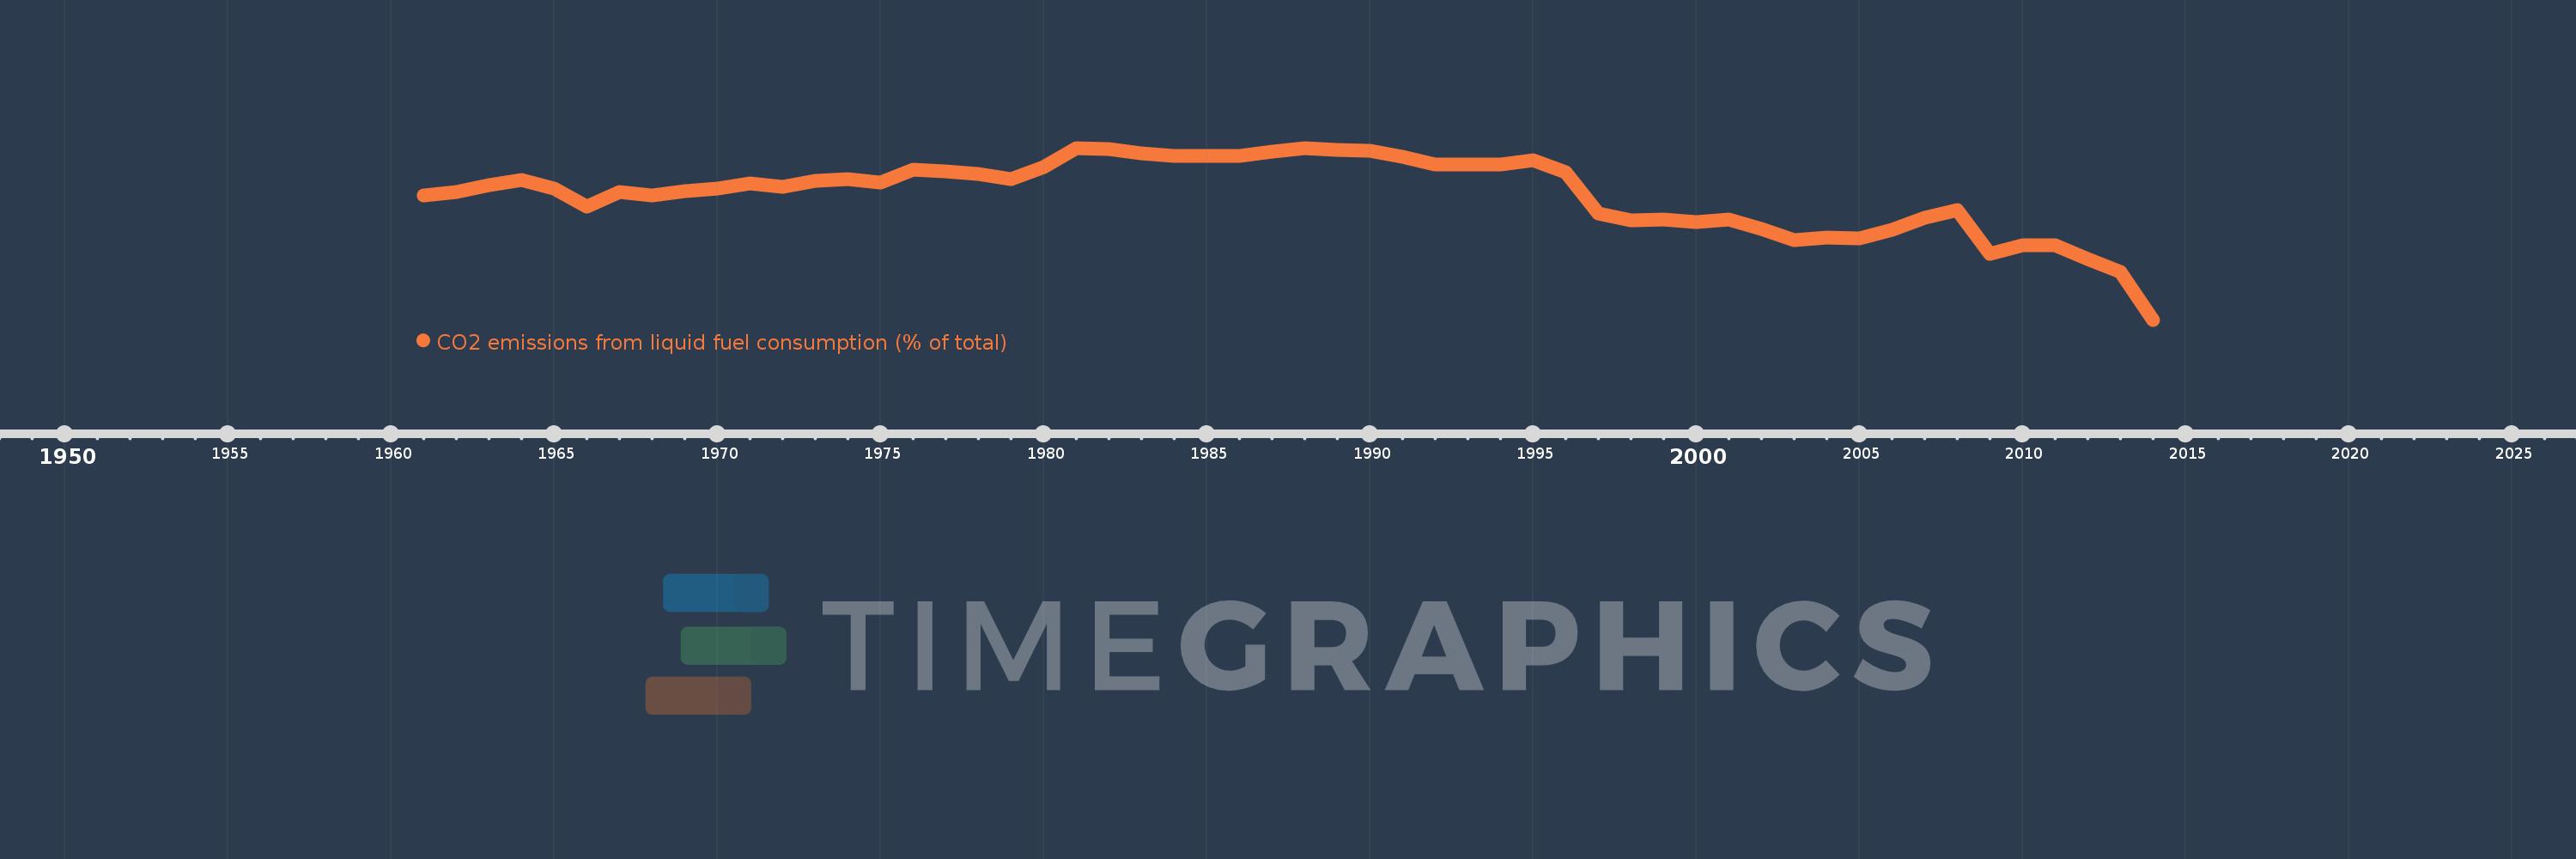
CO2 emissions from liquid fuel consumption (% of total)
2014,2013,2012,2011,2010,2009,2008,2007,2006,2005,2004,2003,2002,2001,2000,1999,1998,1997,1996,1995,1994,1993,1992,1991,1990,1989,1988,1987,1986,1985,1984,1983,1982,1981,1980,1979,1978,1977,1976,1975,1974,1973,1972,1971,1970,1969,1968,1967,1966,1965,1964,1963,1962,1961
This statistics in other country:
AfghanistanAlbaniaAlgeriaAndorraAngolaAntigua and BarbudaArab WorldArgentinaArmeniaArubaAustraliaAustriaAzerbaijanBahamas, TheBahrainBangladeshBarbadosBelarusBelgiumBelizeBeninBermudaBhutanBoliviaBosnia and HerzegovinaBotswanaBrazilBritish Virgin IslandsBrunei DarussalamBulgariaBurkina FasoBurundiCabo VerdeCambodiaCameroonCanadaCaribbean small statesCayman IslandsCentral African RepublicCentral Europe and the BalticsChadChileChinaColombiaComorosCongo, Dem. Rep.Congo, Rep.Costa RicaCote d'IvoireCroatiaCubaCuracaoCyprusCzech RepublicDenmarkDjiboutiDominicaDominican RepublicEarly-demographic dividendEast Asia & PacificEast Asia & Pacific (excluding high income)East Asia & Pacific (IDA & IBRD countries)EcuadorEgypt, Arab Rep.El SalvadorEquatorial GuineaEritreaEstoniaEthiopiaEuro areaEurope & Central AsiaEurope & Central Asia (excluding high income)Europe & Central Asia (IDA & IBRD countries)European UnionFaroe IslandsFijiFinlandFragile and conflict affected situationsFranceFrench PolynesiaGabonGambia, TheGeorgiaGermanyGhanaGibraltarGreeceGreenlandGrenadaGuatemalaGuineaGuinea-BissauGuyanaHaitiHeavily indebted poor countries (HIPC)High incomeHondurasHong Kong SAR, ChinaHungaryIBRD onlyIcelandIDA & IBRD totalIDA blendIDA onlyIDA totalIndiaIndonesiaIran, Islamic Rep.IraqIrelandIsraelItalyJamaicaJapanJordanKazakhstanKenyaKiribatiKorea, Dem. People’s Rep.Korea, Rep.KuwaitKyrgyz RepublicLao PDRLate-demographic dividendLatin America & Caribbean Latin America & Caribbean (excluding high income)Latin America & the Caribbean (IDA & IBRD countries)LatviaLeast developed countries: UN classificationLebanonLesothoLiberiaLibyaLiechtensteinLithuaniaLow & middle incomeLow incomeLower middle incomeLuxembourgMacao SAR, ChinaMacedonia, FYRMadagascarMalawiMalaysiaMaldivesMaliMaltaMarshall IslandsMauritaniaMauritiusMexicoMicronesia, Fed. Sts.Middle East & North AfricaMiddle East & North Africa (excluding high income)Middle East & North Africa (IDA & IBRD countries)Middle incomeMoldovaMongoliaMontenegroMoroccoMozambiqueMyanmarNamibiaNauruNepalNetherlandsNew CaledoniaNew ZealandNicaraguaNigerNigeriaNorth AmericaNorwayOECD membersOmanOther small statesPacific island small statesPakistanPalauPanamaPapua New GuineaParaguayPeruPhilippinesPolandPortugalPost-demographic dividendPre-demographic dividendQatarRomaniaRussian FederationRwandaSamoaSao Tome and PrincipeSaudi ArabiaSenegalSerbiaSeychellesSierra LeoneSingaporeSint Maarten (Dutch part)Slovak RepublicSloveniaSmall statesSolomon IslandsSomaliaSouth AfricaSouth AsiaSouth Asia (IDA & IBRD)South SudanSpainSri LankaSt. Kitts and NevisSt. LuciaSt. Vincent and the GrenadinesSub-Saharan Africa Sub-Saharan Africa (excluding high income)Sub-Saharan Africa (IDA & IBRD countries)SudanSurinameSwazilandSwedenSwitzerlandSyrian Arab RepublicTajikistanTanzaniaThailandTimor-LesteTogoTongaTrinidad and TobagoTunisiaTurkeyTurkmenistanTurks and Caicos IslandsUgandaUkraineUnited Arab EmiratesUnited KingdomUnited StatesUpper middle incomeUruguayUzbekistanVanuatuVenezuela, RBVietnamWest Bank and GazaWorldYemen, Rep.ZambiaZimbabwe Timeline:
This timeline shows a graph from 1961 to 2014 of Uganda. No data until 1960. Number of actual observations by date: 54.
Source name:
World Development Indicators
Source organization:
Carbon Dioxide Information Analysis Center, Environmental Sciences Division, Oak Ridge National Laboratory, Tennessee, United States.
Categories, topics:
Climate Change, Environment
Last updated:
apr 23, 2017
Indicators value changes by year
Minimum:
70.037
jan 1, 2014
Maximum:
99.524
jan 1, 1988
At the date of observation
Value
Absolute change
Change from previous value
jan 1, 1961
91.304
+91.304
0.0%
jan 1, 1962
91.892
+0.588
0.64%
jan 1, 1963
93.162
+1.271
1.38%
jan 1, 1964
94.068
+0.905
0.97%
jan 1, 1965
92.537
-1.53
-1.63%
jan 1, 1966
89.474
-3.064
-3.31%
jan 1, 1967
92.0
+2.526
2.82%
jan 1, 1968
91.403
-0.597
-0.65%
jan 1, 1969
92.164
+0.761
0.83%
jan 1, 1970
92.523
+0.359
0.39%
jan 1, 1971
93.401
+0.878
0.95%
jan 1, 1972
92.875
-0.526
-0.56%
jan 1, 1973
93.899
+1.024
1.1%
jan 1, 1974
94.099
+0.2
0.21%
jan 1, 1975
93.558
-0.541
-0.58%
jan 1, 1976
95.793
+2.235
2.39%
jan 1, 1977
95.556
-0.237
-0.25%
jan 1, 1978
95.0
-0.556
-0.58%
jan 1, 1979
94.241
-0.759
-0.8%
jan 1, 1980
96.196
+1.955
2.07%
jan 1, 1981
99.415
+3.22
3.35%
jan 1, 1982
99.306
-0.11
-0.11%
jan 1, 1983
98.658
-0.648
-0.65%
jan 1, 1984
98.214
-0.443
-0.45%
jan 1, 1985
98.113
-0.101
-0.1%
jan 1, 1986
98.225
+0.112
0.11%
jan 1, 1987
98.958
+0.733
0.75%
jan 1, 1988
99.524
+0.565
0.57%
jan 1, 1989
99.153
-0.371
-0.37%
jan 1, 1990
99.087
-0.066
-0.07%
jan 1, 1991
98.068
-1.019
-1.03%
jan 1, 1992
96.714
-1.354
-1.38%
jan 1, 1993
96.744
+0.031
0.03%
jan 1, 1994
96.714
-0.031
-0.03%
jan 1, 1995
97.409
+0.696
0.72%
jan 1, 1996
95.313
-2.097
-2.15%
jan 1, 1997
88.235
-7.077
-7.43%
jan 1, 1998
87.086
-1.149
-1.3%
jan 1, 1999
87.246
+0.16
0.18%
jan 1, 2000
86.872
-0.375
-0.43%
jan 1, 2001
87.179
+0.308
0.35%
jan 1, 2002
85.68
-1.5
-1.72%
jan 1, 2003
83.765
-1.915
-2.23%
jan 1, 2004
84.174
+0.41
0.49%
jan 1, 2005
83.966
-0.208
-0.25%
jan 1, 2006
85.473
+1.507
1.79%
jan 1, 2007
87.572
+2.099
2.46%
jan 1, 2008
88.832
+1.26
1.44%
jan 1, 2009
81.379
-7.453
-8.39%
jan 1, 2010
82.863
+1.484
1.82%
jan 1, 2011
82.881
+0.018
0.02%
jan 1, 2012
80.482
-2.4
-2.9%
jan 1, 2013
78.276
-2.205
-2.74%
jan 1, 2014
70.037
-8.239
-10.53%
Ranking of countries by current statistics by years


Comments: