29
/
en
AIzaSyAYiBZKx7MnpbEhh9jyipgxe19OcubqV5w
April 1, 2024
216153
Pakistan
PAK
true
2
1
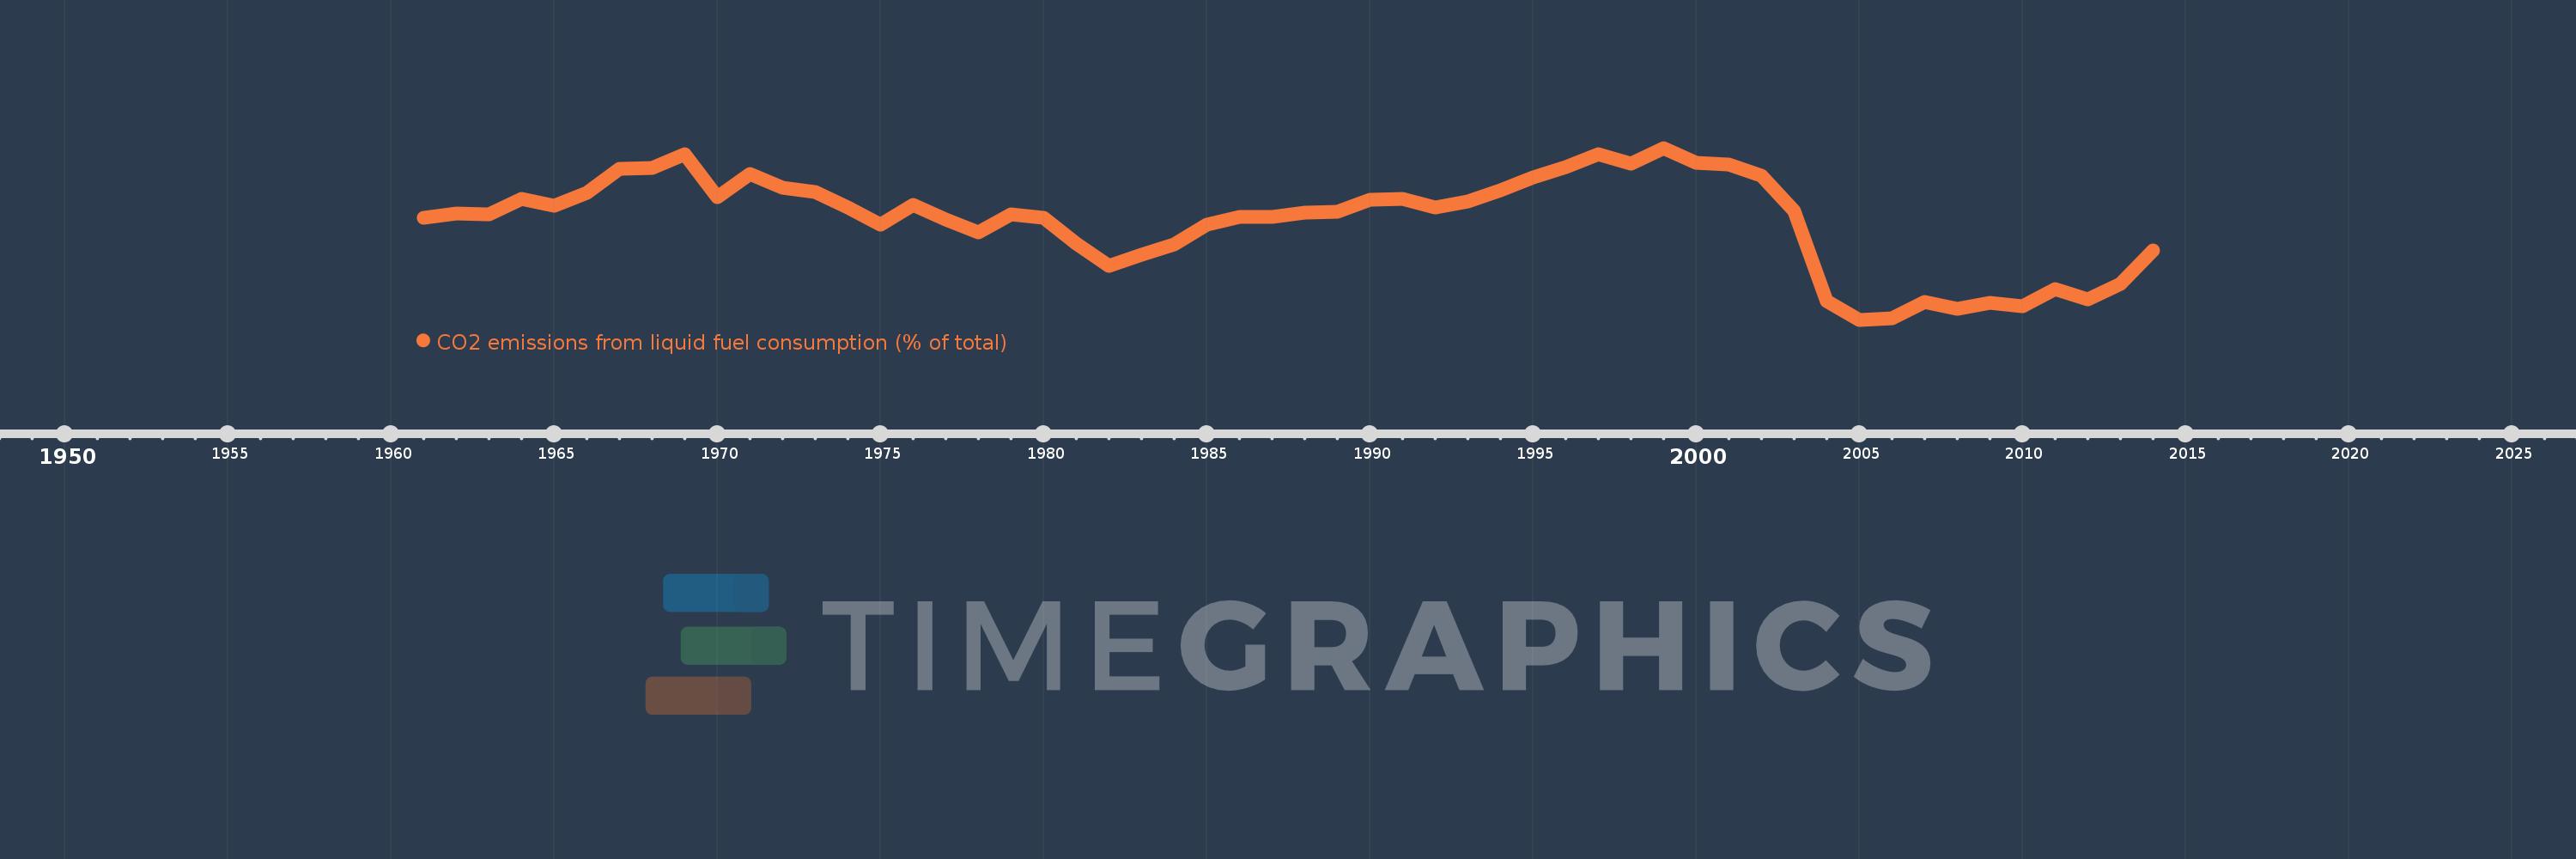
CO2 emissions from liquid fuel consumption (% of total)
2014,2013,2012,2011,2010,2009,2008,2007,2006,2005,2004,2003,2002,2001,2000,1999,1998,1997,1996,1995,1994,1993,1992,1991,1990,1989,1988,1987,1986,1985,1984,1983,1982,1981,1980,1979,1978,1977,1976,1975,1974,1973,1972,1971,1970,1969,1968,1967,1966,1965,1964,1963,1962,1961
This statistics in other country:
AfghanistanAlbaniaAlgeriaAndorraAngolaAntigua and BarbudaArab WorldArgentinaArmeniaArubaAustraliaAustriaAzerbaijanBahamas, TheBahrainBangladeshBarbadosBelarusBelgiumBelizeBeninBermudaBhutanBoliviaBosnia and HerzegovinaBotswanaBrazilBritish Virgin IslandsBrunei DarussalamBulgariaBurkina FasoBurundiCabo VerdeCambodiaCameroonCanadaCaribbean small statesCayman IslandsCentral African RepublicCentral Europe and the BalticsChadChileChinaColombiaComorosCongo, Dem. Rep.Congo, Rep.Costa RicaCote d'IvoireCroatiaCubaCuracaoCyprusCzech RepublicDenmarkDjiboutiDominicaDominican RepublicEarly-demographic dividendEast Asia & PacificEast Asia & Pacific (excluding high income)East Asia & Pacific (IDA & IBRD countries)EcuadorEgypt, Arab Rep.El SalvadorEquatorial GuineaEritreaEstoniaEthiopiaEuro areaEurope & Central AsiaEurope & Central Asia (excluding high income)Europe & Central Asia (IDA & IBRD countries)European UnionFaroe IslandsFijiFinlandFragile and conflict affected situationsFranceFrench PolynesiaGabonGambia, TheGeorgiaGermanyGhanaGibraltarGreeceGreenlandGrenadaGuatemalaGuineaGuinea-BissauGuyanaHaitiHeavily indebted poor countries (HIPC)High incomeHondurasHong Kong SAR, ChinaHungaryIBRD onlyIcelandIDA & IBRD totalIDA blendIDA onlyIDA totalIndiaIndonesiaIran, Islamic Rep.IraqIrelandIsraelItalyJamaicaJapanJordanKazakhstanKenyaKiribatiKorea, Dem. People’s Rep.Korea, Rep.KuwaitKyrgyz RepublicLao PDRLate-demographic dividendLatin America & Caribbean Latin America & Caribbean (excluding high income)Latin America & the Caribbean (IDA & IBRD countries)LatviaLeast developed countries: UN classificationLebanonLesothoLiberiaLibyaLiechtensteinLithuaniaLow & middle incomeLow incomeLower middle incomeLuxembourgMacao SAR, ChinaMacedonia, FYRMadagascarMalawiMalaysiaMaldivesMaliMaltaMarshall IslandsMauritaniaMauritiusMexicoMicronesia, Fed. Sts.Middle East & North AfricaMiddle East & North Africa (excluding high income)Middle East & North Africa (IDA & IBRD countries)Middle incomeMoldovaMongoliaMontenegroMoroccoMozambiqueMyanmarNamibiaNauruNepalNetherlandsNew CaledoniaNew ZealandNicaraguaNigerNigeriaNorth AmericaNorwayOECD membersOmanOther small statesPacific island small statesPakistanPalauPanamaPapua New GuineaParaguayPeruPhilippinesPolandPortugalPost-demographic dividendPre-demographic dividendQatarRomaniaRussian FederationRwandaSamoaSao Tome and PrincipeSaudi ArabiaSenegalSerbiaSeychellesSierra LeoneSingaporeSint Maarten (Dutch part)Slovak RepublicSloveniaSmall statesSolomon IslandsSomaliaSouth AfricaSouth AsiaSouth Asia (IDA & IBRD)South SudanSpainSri LankaSt. Kitts and NevisSt. LuciaSt. Vincent and the GrenadinesSub-Saharan Africa Sub-Saharan Africa (excluding high income)Sub-Saharan Africa (IDA & IBRD countries)SudanSurinameSwazilandSwedenSwitzerlandSyrian Arab RepublicTajikistanTanzaniaThailandTimor-LesteTogoTongaTrinidad and TobagoTunisiaTurkeyTurkmenistanTurks and Caicos IslandsUgandaUkraineUnited Arab EmiratesUnited KingdomUnited StatesUpper middle incomeUruguayUzbekistanVanuatuVenezuela, RBVietnamWest Bank and GazaWorldYemen, Rep.ZambiaZimbabwe Timeline:
This timeline shows a graph from 1961 to 2014 of Pakistan. No data until 1960. Number of actual observations by date: 54.
Source name:
World Development Indicators
Source organization:
Carbon Dioxide Information Analysis Center, Environmental Sciences Division, Oak Ridge National Laboratory, Tennessee, United States.
Categories, topics:
Climate Change, Environment
Last updated:
apr 23, 2017
Indicators value changes by year
Minimum:
35.237
jan 1, 2005
Maximum:
53.881
jan 1, 1999
At the date of observation
Value
Absolute change
Change from previous value
jan 1, 1961
46.295
+46.295
0.0%
jan 1, 1962
46.785
+0.49
1.06%
jan 1, 1963
46.699
-0.087
-0.18%
jan 1, 1964
48.386
+1.687
3.61%
jan 1, 1965
47.64
-0.746
-1.54%
jan 1, 1966
48.999
+1.359
2.85%
jan 1, 1967
51.651
+2.651
5.41%
jan 1, 1968
51.691
+0.041
0.08%
jan 1, 1969
53.217
+1.525
2.95%
jan 1, 1970
48.571
-4.646
-8.73%
jan 1, 1971
51.032
+2.461
5.07%
jan 1, 1972
49.579
-1.453
-2.85%
jan 1, 1973
49.09
-0.489
-0.99%
jan 1, 1974
47.383
-1.707
-3.48%
jan 1, 1975
45.592
-1.791
-3.78%
jan 1, 1976
47.694
+2.103
4.61%
jan 1, 1977
46.146
-1.548
-3.25%
jan 1, 1978
44.715
-1.431
-3.1%
jan 1, 1979
46.675
+1.96
4.38%
jan 1, 1980
46.275
-0.4
-0.86%
jan 1, 1981
43.465
-2.81
-6.07%
jan 1, 1982
41.115
-2.35
-5.41%
jan 1, 1983
42.325
+1.21
2.94%
jan 1, 1984
43.372
+1.047
2.47%
jan 1, 1985
45.546
+2.174
5.01%
jan 1, 1986
46.351
+0.804
1.77%
jan 1, 1987
46.381
+0.031
0.07%
jan 1, 1988
46.818
+0.437
0.94%
jan 1, 1989
46.986
+0.168
0.36%
jan 1, 1990
48.301
+1.315
2.8%
jan 1, 1991
48.353
+0.052
0.11%
jan 1, 1992
47.389
-0.964
-1.99%
jan 1, 1993
48.086
+0.697
1.47%
jan 1, 1994
49.246
+1.16
2.41%
jan 1, 1995
50.709
+1.463
2.97%
jan 1, 1996
51.76
+1.051
2.07%
jan 1, 1997
53.172
+1.412
2.73%
jan 1, 1998
52.157
-1.016
-1.91%
jan 1, 1999
53.881
+1.724
3.31%
jan 1, 2000
52.289
-1.592
-2.95%
jan 1, 2001
52.079
-0.21
-0.4%
jan 1, 2002
50.916
-1.163
-2.23%
jan 1, 2003
47.073
-3.843
-7.55%
jan 1, 2004
37.217
-9.856
-20.94%
jan 1, 2005
35.237
-1.98
-5.32%
jan 1, 2006
35.426
+0.188
0.53%
jan 1, 2007
37.148
+1.722
4.86%
jan 1, 2008
36.454
-0.694
-1.87%
jan 1, 2009
37.076
+0.621
1.7%
jan 1, 2010
36.74
-0.335
-0.9%
jan 1, 2011
38.6
+1.86
5.06%
jan 1, 2012
37.411
-1.189
-3.08%
jan 1, 2013
39.157
+1.747
4.67%
jan 1, 2014
42.765
+3.608
9.21%
Ranking of countries by current statistics by years


Comments: