29
/
en
AIzaSyAYiBZKx7MnpbEhh9jyipgxe19OcubqV5w
April 1, 2024
154344
India
IND
true
2
1
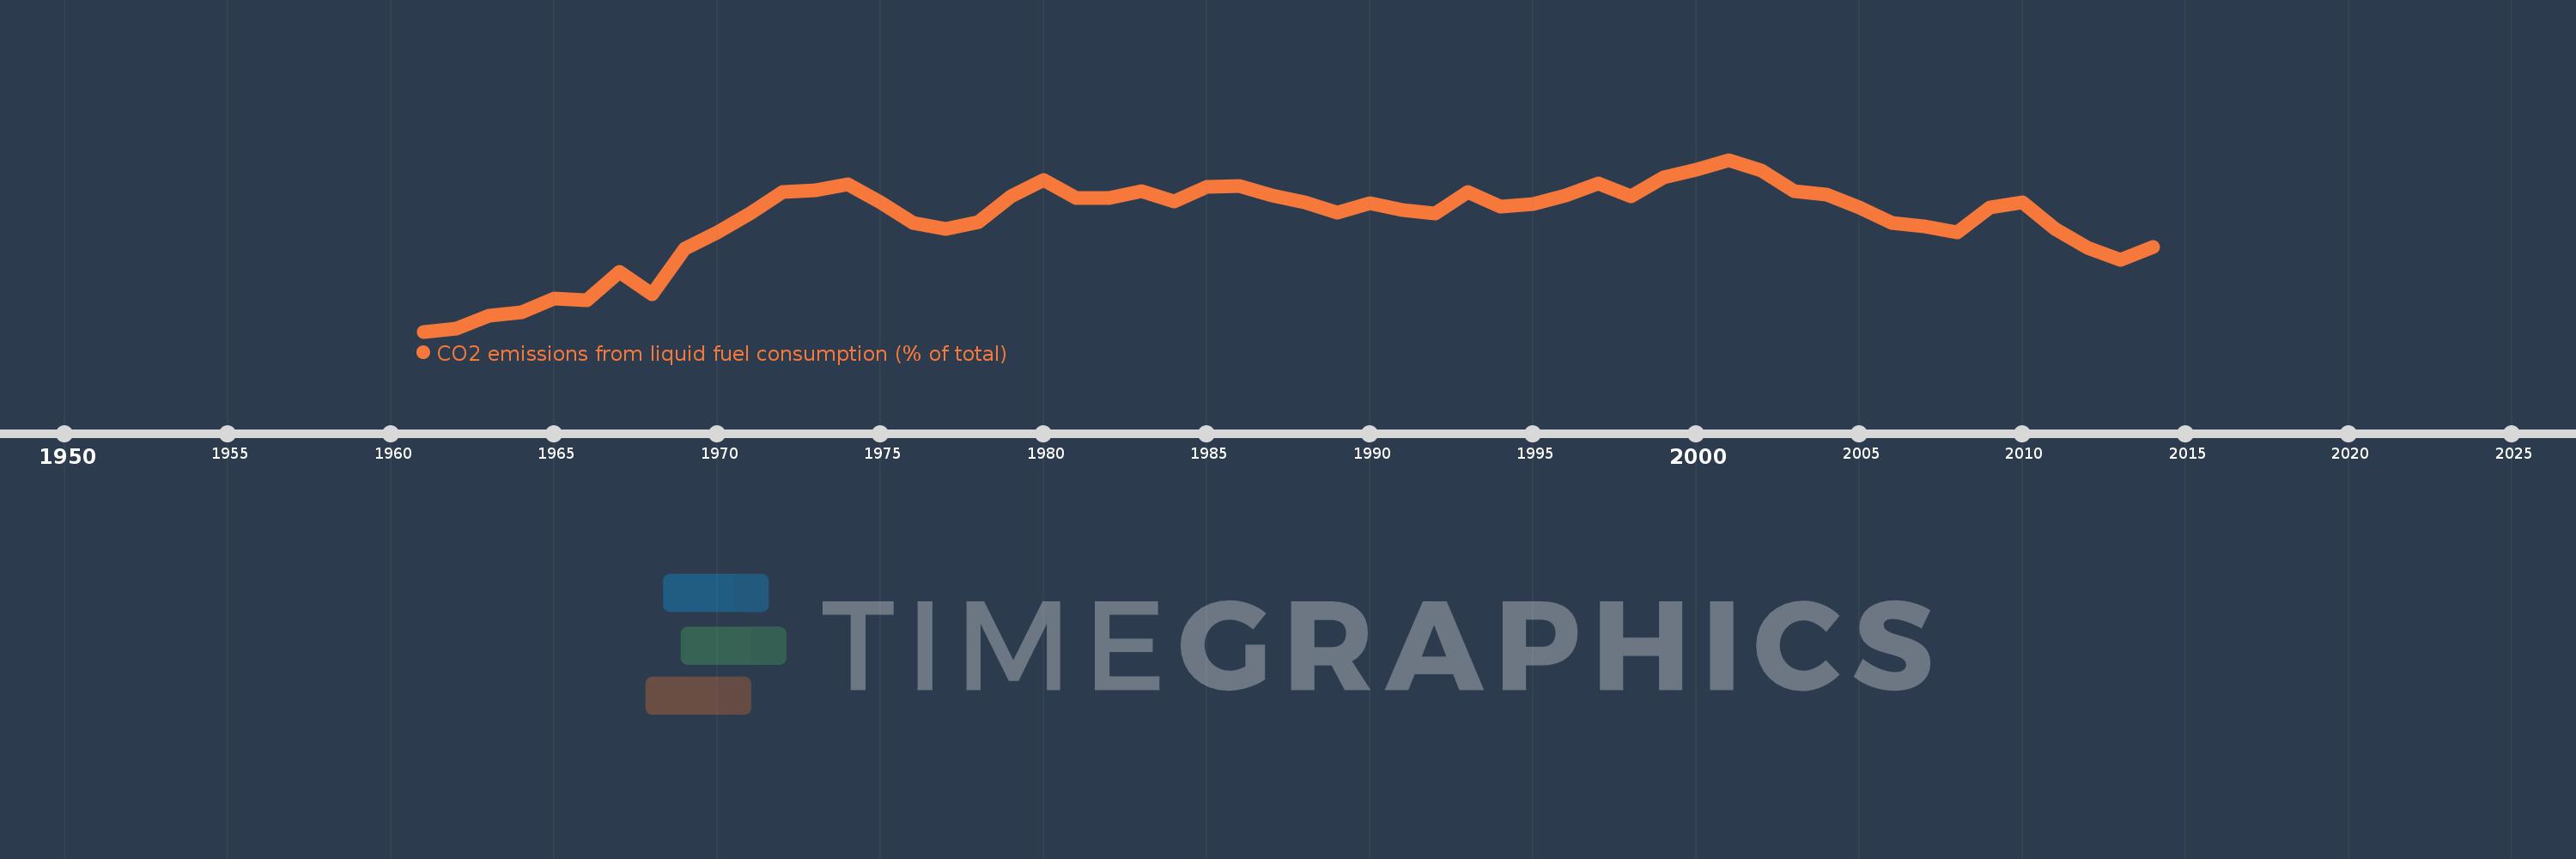
CO2 emissions from liquid fuel consumption (% of total)
2014,2013,2012,2011,2010,2009,2008,2007,2006,2005,2004,2003,2002,2001,2000,1999,1998,1997,1996,1995,1994,1993,1992,1991,1990,1989,1988,1987,1986,1985,1984,1983,1982,1981,1980,1979,1978,1977,1976,1975,1974,1973,1972,1971,1970,1969,1968,1967,1966,1965,1964,1963,1962,1961
This statistics in other country:
AfghanistanAlbaniaAlgeriaAndorraAngolaAntigua and BarbudaArab WorldArgentinaArmeniaArubaAustraliaAustriaAzerbaijanBahamas, TheBahrainBangladeshBarbadosBelarusBelgiumBelizeBeninBermudaBhutanBoliviaBosnia and HerzegovinaBotswanaBrazilBritish Virgin IslandsBrunei DarussalamBulgariaBurkina FasoBurundiCabo VerdeCambodiaCameroonCanadaCaribbean small statesCayman IslandsCentral African RepublicCentral Europe and the BalticsChadChileChinaColombiaComorosCongo, Dem. Rep.Congo, Rep.Costa RicaCote d'IvoireCroatiaCubaCuracaoCyprusCzech RepublicDenmarkDjiboutiDominicaDominican RepublicEarly-demographic dividendEast Asia & PacificEast Asia & Pacific (excluding high income)East Asia & Pacific (IDA & IBRD countries)EcuadorEgypt, Arab Rep.El SalvadorEquatorial GuineaEritreaEstoniaEthiopiaEuro areaEurope & Central AsiaEurope & Central Asia (excluding high income)Europe & Central Asia (IDA & IBRD countries)European UnionFaroe IslandsFijiFinlandFragile and conflict affected situationsFranceFrench PolynesiaGabonGambia, TheGeorgiaGermanyGhanaGibraltarGreeceGreenlandGrenadaGuatemalaGuineaGuinea-BissauGuyanaHaitiHeavily indebted poor countries (HIPC)High incomeHondurasHong Kong SAR, ChinaHungaryIBRD onlyIcelandIDA & IBRD totalIDA blendIDA onlyIDA totalIndiaIndonesiaIran, Islamic Rep.IraqIrelandIsraelItalyJamaicaJapanJordanKazakhstanKenyaKiribatiKorea, Dem. People’s Rep.Korea, Rep.KuwaitKyrgyz RepublicLao PDRLate-demographic dividendLatin America & Caribbean Latin America & Caribbean (excluding high income)Latin America & the Caribbean (IDA & IBRD countries)LatviaLeast developed countries: UN classificationLebanonLesothoLiberiaLibyaLiechtensteinLithuaniaLow & middle incomeLow incomeLower middle incomeLuxembourgMacao SAR, ChinaMacedonia, FYRMadagascarMalawiMalaysiaMaldivesMaliMaltaMarshall IslandsMauritaniaMauritiusMexicoMicronesia, Fed. Sts.Middle East & North AfricaMiddle East & North Africa (excluding high income)Middle East & North Africa (IDA & IBRD countries)Middle incomeMoldovaMongoliaMontenegroMoroccoMozambiqueMyanmarNamibiaNauruNepalNetherlandsNew CaledoniaNew ZealandNicaraguaNigerNigeriaNorth AmericaNorwayOECD membersOmanOther small statesPacific island small statesPakistanPalauPanamaPapua New GuineaParaguayPeruPhilippinesPolandPortugalPost-demographic dividendPre-demographic dividendQatarRomaniaRussian FederationRwandaSamoaSao Tome and PrincipeSaudi ArabiaSenegalSerbiaSeychellesSierra LeoneSingaporeSint Maarten (Dutch part)Slovak RepublicSloveniaSmall statesSolomon IslandsSomaliaSouth AfricaSouth AsiaSouth Asia (IDA & IBRD)South SudanSpainSri LankaSt. Kitts and NevisSt. LuciaSt. Vincent and the GrenadinesSub-Saharan Africa Sub-Saharan Africa (excluding high income)Sub-Saharan Africa (IDA & IBRD countries)SudanSurinameSwazilandSwedenSwitzerlandSyrian Arab RepublicTajikistanTanzaniaThailandTimor-LesteTogoTongaTrinidad and TobagoTunisiaTurkeyTurkmenistanTurks and Caicos IslandsUgandaUkraineUnited Arab EmiratesUnited KingdomUnited StatesUpper middle incomeUruguayUzbekistanVanuatuVenezuela, RBVietnamWest Bank and GazaWorldYemen, Rep.ZambiaZimbabwe Timeline:
This timeline shows a graph from 1961 to 2014 of India. No data until 1960. Number of actual observations by date: 54.
Source name:
World Development Indicators
Source organization:
Carbon Dioxide Information Analysis Center, Environmental Sciences Division, Oak Ridge National Laboratory, Tennessee, United States.
Categories, topics:
Climate Change, Environment
Last updated:
apr 23, 2017
Indicators value changes by year
Minimum:
16.139
jan 1, 1961
Maximum:
29.438
jan 1, 2001
At the date of observation
Value
Absolute change
Change from previous value
jan 1, 1961
16.139
+16.139
0.0%
jan 1, 1962
16.355
+0.216
1.34%
jan 1, 1963
17.36
+1.005
6.15%
jan 1, 1964
17.606
+0.246
1.42%
jan 1, 1965
18.682
+1.076
6.11%
jan 1, 1966
18.581
-0.101
-0.54%
jan 1, 1967
20.787
+2.206
11.87%
jan 1, 1968
18.999
-1.788
-8.6%
jan 1, 1969
22.571
+3.572
18.8%
jan 1, 1970
23.797
+1.226
5.43%
jan 1, 1971
25.301
+1.504
6.32%
jan 1, 1972
26.954
+1.653
6.53%
jan 1, 1973
27.049
+0.095
0.35%
jan 1, 1974
27.547
+0.498
1.84%
jan 1, 1975
26.155
-1.392
-5.05%
jan 1, 1976
24.539
-1.616
-6.18%
jan 1, 1977
24.069
-0.47
-1.92%
jan 1, 1978
24.588
+0.519
2.16%
jan 1, 1979
26.627
+2.039
8.29%
jan 1, 1980
27.866
+1.239
4.65%
jan 1, 1981
26.51
-1.356
-4.87%
jan 1, 1982
26.498
-0.011
-0.04%
jan 1, 1983
27.023
+0.525
1.98%
jan 1, 1984
26.21
-0.813
-3.01%
jan 1, 1985
27.361
+1.15
4.39%
jan 1, 1986
27.388
+0.027
0.1%
jan 1, 1987
26.653
-0.735
-2.68%
jan 1, 1988
26.158
-0.495
-1.86%
jan 1, 1989
25.348
-0.81
-3.1%
jan 1, 1990
26.051
+0.704
2.78%
jan 1, 1991
25.567
-0.485
-1.86%
jan 1, 1992
25.306
-0.261
-1.02%
jan 1, 1993
26.922
+1.616
6.39%
jan 1, 1994
25.844
-1.078
-4.0%
jan 1, 1995
26.038
+0.194
0.75%
jan 1, 1996
26.672
+0.634
2.44%
jan 1, 1997
27.582
+0.91
3.41%
jan 1, 1998
26.632
-0.949
-3.44%
jan 1, 1999
28.103
+1.471
5.52%
jan 1, 2000
28.67
+0.567
2.02%
jan 1, 2001
29.438
+0.768
2.68%
jan 1, 2002
28.629
-0.809
-2.75%
jan 1, 2003
27.017
-1.611
-5.63%
jan 1, 2004
26.724
-0.294
-1.09%
jan 1, 2005
25.717
-1.006
-3.77%
jan 1, 2006
24.54
-1.178
-4.58%
jan 1, 2007
24.308
-0.232
-0.95%
jan 1, 2008
23.852
-0.456
-1.88%
jan 1, 2009
25.721
+1.869
7.84%
jan 1, 2010
26.16
+0.439
1.71%
jan 1, 2011
24.089
-2.071
-7.92%
jan 1, 2012
22.619
-1.47
-6.1%
jan 1, 2013
21.691
-0.928
-4.1%
jan 1, 2014
22.665
+0.974
4.49%
Ranking of countries by current statistics by years


Comments: