29
/
en
AIzaSyAYiBZKx7MnpbEhh9jyipgxe19OcubqV5w
April 1, 2024
186264
Malawi
MWI
true
2
1
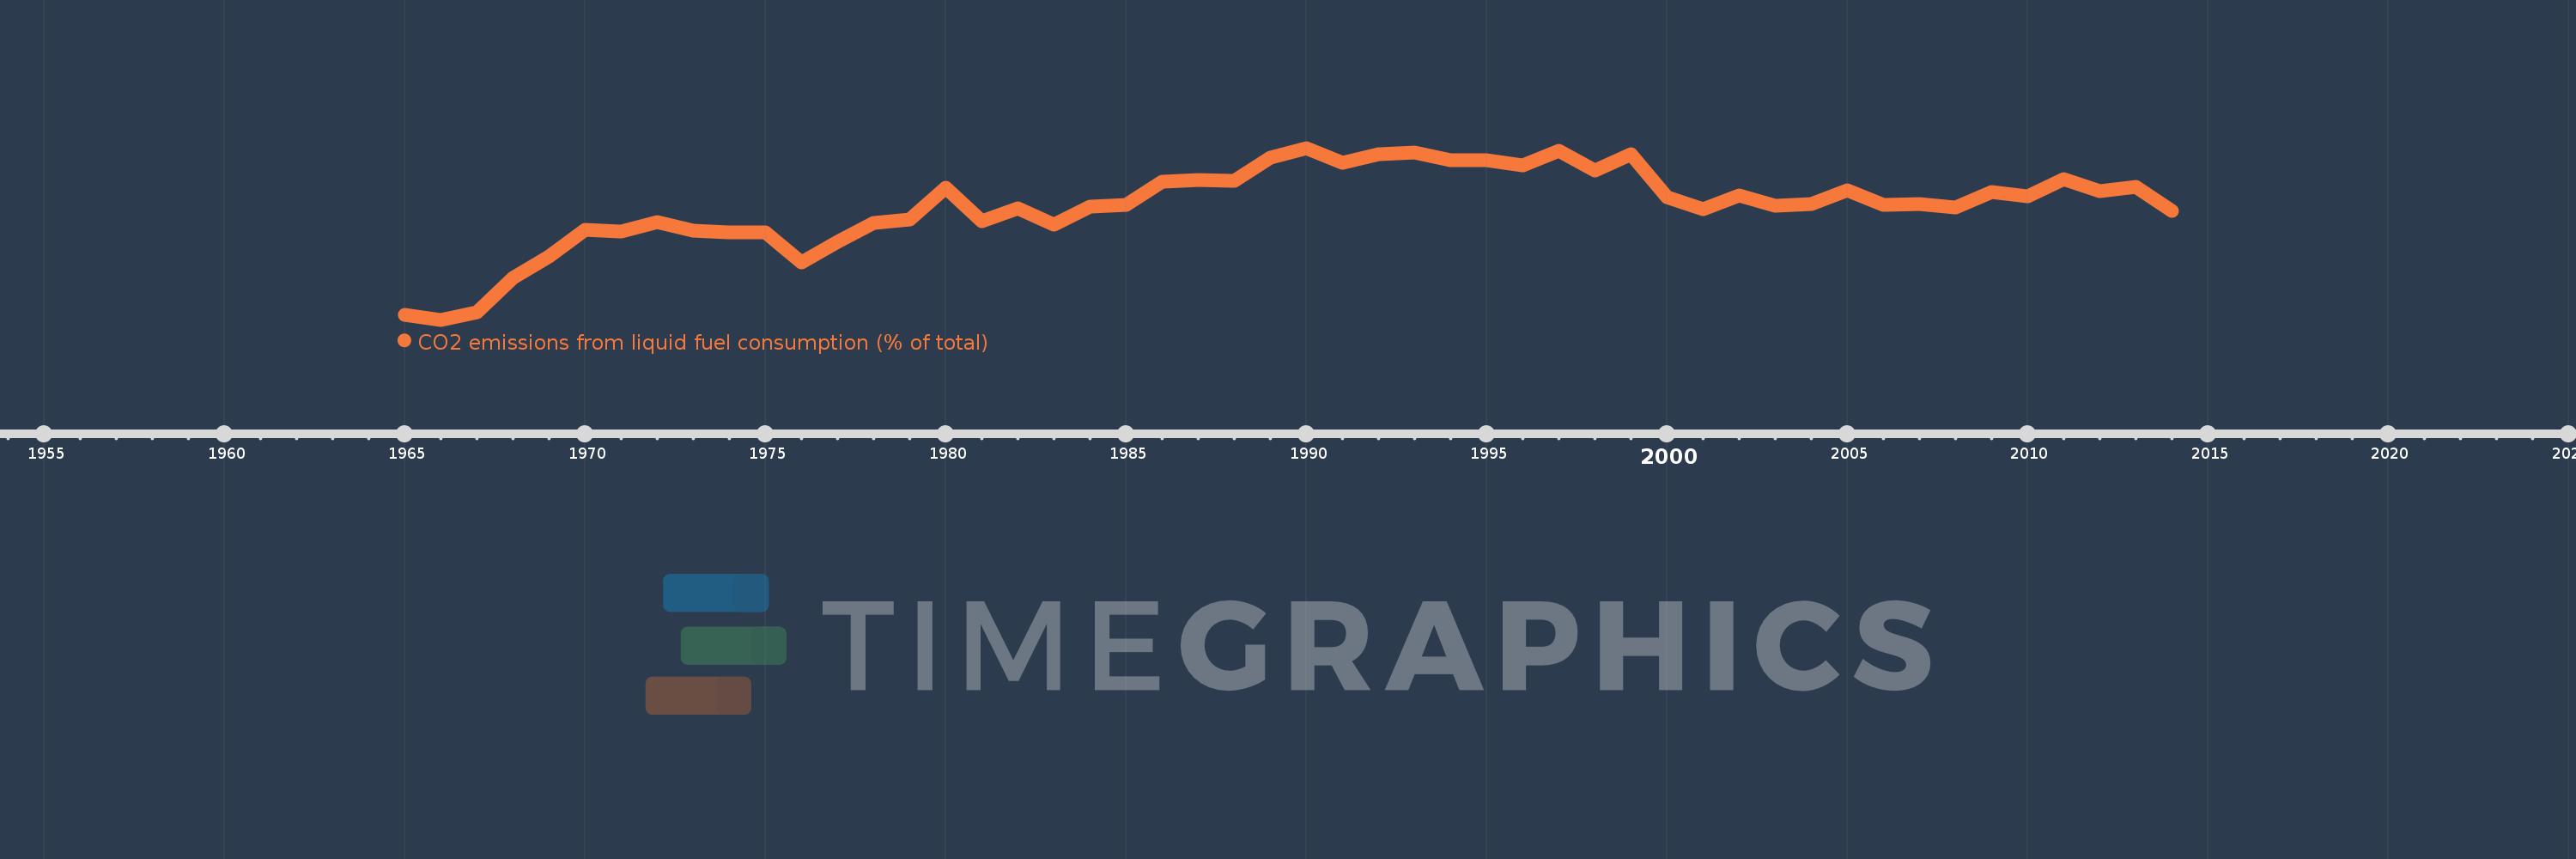
CO2 emissions from liquid fuel consumption (% of total)
2014,2013,2012,2011,2010,2009,2008,2007,2006,2005,2004,2003,2002,2001,2000,1999,1998,1997,1996,1995,1994,1993,1992,1991,1990,1989,1988,1987,1986,1985,1984,1983,1982,1981,1980,1979,1978,1977,1976,1975,1974,1973,1972,1971,1970,1969,1968,1967,1966,1965
This statistics in other country:
AfghanistanAlbaniaAlgeriaAndorraAngolaAntigua and BarbudaArab WorldArgentinaArmeniaArubaAustraliaAustriaAzerbaijanBahamas, TheBahrainBangladeshBarbadosBelarusBelgiumBelizeBeninBermudaBhutanBoliviaBosnia and HerzegovinaBotswanaBrazilBritish Virgin IslandsBrunei DarussalamBulgariaBurkina FasoBurundiCabo VerdeCambodiaCameroonCanadaCaribbean small statesCayman IslandsCentral African RepublicCentral Europe and the BalticsChadChileChinaColombiaComorosCongo, Dem. Rep.Congo, Rep.Costa RicaCote d'IvoireCroatiaCubaCuracaoCyprusCzech RepublicDenmarkDjiboutiDominicaDominican RepublicEarly-demographic dividendEast Asia & PacificEast Asia & Pacific (excluding high income)East Asia & Pacific (IDA & IBRD countries)EcuadorEgypt, Arab Rep.El SalvadorEquatorial GuineaEritreaEstoniaEthiopiaEuro areaEurope & Central AsiaEurope & Central Asia (excluding high income)Europe & Central Asia (IDA & IBRD countries)European UnionFaroe IslandsFijiFinlandFragile and conflict affected situationsFranceFrench PolynesiaGabonGambia, TheGeorgiaGermanyGhanaGibraltarGreeceGreenlandGrenadaGuatemalaGuineaGuinea-BissauGuyanaHaitiHeavily indebted poor countries (HIPC)High incomeHondurasHong Kong SAR, ChinaHungaryIBRD onlyIcelandIDA & IBRD totalIDA blendIDA onlyIDA totalIndiaIndonesiaIran, Islamic Rep.IraqIrelandIsraelItalyJamaicaJapanJordanKazakhstanKenyaKiribatiKorea, Dem. People’s Rep.Korea, Rep.KuwaitKyrgyz RepublicLao PDRLate-demographic dividendLatin America & Caribbean Latin America & Caribbean (excluding high income)Latin America & the Caribbean (IDA & IBRD countries)LatviaLeast developed countries: UN classificationLebanonLesothoLiberiaLibyaLiechtensteinLithuaniaLow & middle incomeLow incomeLower middle incomeLuxembourgMacao SAR, ChinaMacedonia, FYRMadagascarMalawiMalaysiaMaldivesMaliMaltaMarshall IslandsMauritaniaMauritiusMexicoMicronesia, Fed. Sts.Middle East & North AfricaMiddle East & North Africa (excluding high income)Middle East & North Africa (IDA & IBRD countries)Middle incomeMoldovaMongoliaMontenegroMoroccoMozambiqueMyanmarNamibiaNauruNepalNetherlandsNew CaledoniaNew ZealandNicaraguaNigerNigeriaNorth AmericaNorwayOECD membersOmanOther small statesPacific island small statesPakistanPalauPanamaPapua New GuineaParaguayPeruPhilippinesPolandPortugalPost-demographic dividendPre-demographic dividendQatarRomaniaRussian FederationRwandaSamoaSao Tome and PrincipeSaudi ArabiaSenegalSerbiaSeychellesSierra LeoneSingaporeSint Maarten (Dutch part)Slovak RepublicSloveniaSmall statesSolomon IslandsSomaliaSouth AfricaSouth AsiaSouth Asia (IDA & IBRD)South SudanSpainSri LankaSt. Kitts and NevisSt. LuciaSt. Vincent and the GrenadinesSub-Saharan Africa Sub-Saharan Africa (excluding high income)Sub-Saharan Africa (IDA & IBRD countries)SudanSurinameSwazilandSwedenSwitzerlandSyrian Arab RepublicTajikistanTanzaniaThailandTimor-LesteTogoTongaTrinidad and TobagoTunisiaTurkeyTurkmenistanTurks and Caicos IslandsUgandaUkraineUnited Arab EmiratesUnited KingdomUnited StatesUpper middle incomeUruguayUzbekistanVanuatuVenezuela, RBVietnamWest Bank and GazaWorldYemen, Rep.ZambiaZimbabwe Timeline:
This timeline shows a graph from 1965 to 2014 of Malawi. No data until 1964. Number of actual observations by date: 50.
Source name:
World Development Indicators
Source organization:
Carbon Dioxide Information Analysis Center, Environmental Sciences Division, Oak Ridge National Laboratory, Tennessee, United States.
Categories, topics:
Climate Change, Environment
Last updated:
apr 23, 2017
Indicators value changes by year
Minimum:
44.211
jan 1, 1966
Maximum:
88.312
jan 1, 1990
At the date of observation
Value
Absolute change
Change from previous value
jan 1, 1965
45.556
+45.556
0.0%
jan 1, 1966
44.211
-1.345
-2.95%
jan 1, 1967
46.154
+1.943
4.4%
jan 1, 1968
55.0
+8.846
19.17%
jan 1, 1969
60.377
+5.377
9.78%
jan 1, 1970
67.308
+6.93
11.48%
jan 1, 1971
66.935
-0.372
-0.55%
jan 1, 1972
69.343
+2.408
3.6%
jan 1, 1973
67.114
-2.229
-3.21%
jan 1, 1974
66.667
-0.447
-0.67%
jan 1, 1975
66.667
0.0
0.0%
jan 1, 1976
58.861
-7.806
-11.71%
jan 1, 1977
64.151
+5.29
8.99%
jan 1, 1978
68.966
+4.815
7.51%
jan 1, 1979
69.945
+0.98
1.42%
jan 1, 1980
78.161
+8.216
11.75%
jan 1, 1981
69.588
-8.573
-10.97%
jan 1, 1982
72.727
+3.14
4.51%
jan 1, 1983
68.519
-4.209
-5.79%
jan 1, 1984
73.248
+4.73
6.9%
jan 1, 1985
73.684
+0.436
0.59%
jan 1, 1986
79.605
+5.921
8.04%
jan 1, 1987
80.132
+0.527
0.66%
jan 1, 1988
79.866
-0.267
-0.33%
jan 1, 1989
85.811
+5.945
7.44%
jan 1, 1990
88.312
+2.501
2.91%
jan 1, 1991
84.431
-3.881
-4.39%
jan 1, 1992
86.667
+2.236
2.65%
jan 1, 1993
87.151
+0.484
0.56%
jan 1, 1994
85.185
-1.966
-2.26%
jan 1, 1995
85.204
+0.019
0.02%
jan 1, 1996
83.92
-1.284
-1.51%
jan 1, 1997
87.629
+3.709
4.42%
jan 1, 1998
82.609
-5.02
-5.73%
jan 1, 1999
86.73
+4.121
4.99%
jan 1, 2000
75.573
-11.157
-12.86%
jan 1, 2001
72.541
-3.032
-4.01%
jan 1, 2002
76.132
+3.591
4.95%
jan 1, 2003
73.444
-2.688
-3.53%
jan 1, 2004
73.946
+0.502
0.68%
jan 1, 2005
77.444
+3.497
4.73%
jan 1, 2006
73.6
-3.844
-4.96%
jan 1, 2007
73.846
+0.246
0.33%
jan 1, 2008
73.047
-0.799
-1.08%
jan 1, 2009
76.923
+3.876
5.31%
jan 1, 2010
75.912
-1.011
-1.31%
jan 1, 2011
80.308
+4.395
5.79%
jan 1, 2012
77.16
-3.147
-3.92%
jan 1, 2013
78.247
+1.086
1.41%
jan 1, 2014
72.046
-6.201
-7.92%
Ranking of countries by current statistics by years


Comments: