29
/
en
AIzaSyAYiBZKx7MnpbEhh9jyipgxe19OcubqV5w
April 1, 2024
206510
Nepal
NPL
true
2
1
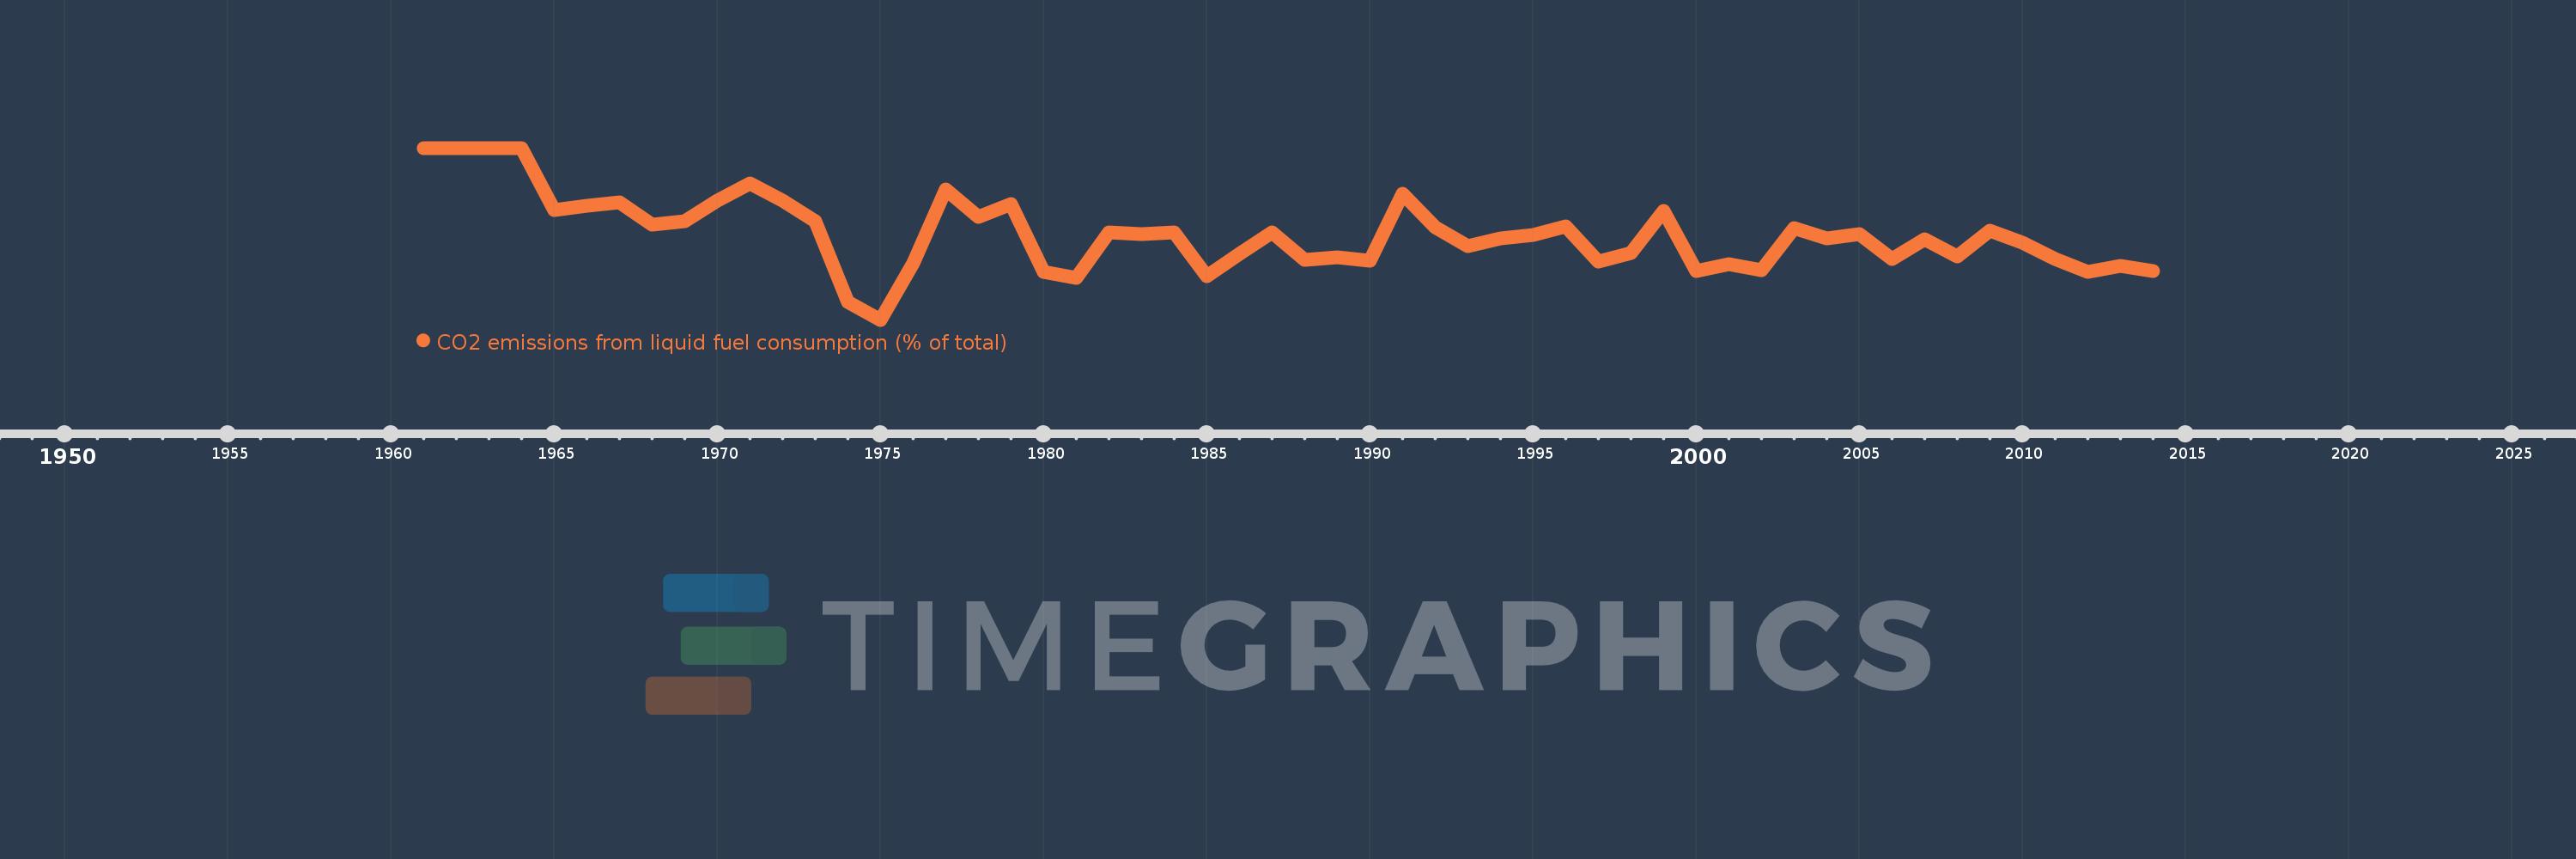
CO2 emissions from liquid fuel consumption (% of total)
2014,2013,2012,2011,2010,2009,2008,2007,2006,2005,2004,2003,2002,2001,2000,1999,1998,1997,1996,1995,1994,1993,1992,1991,1990,1989,1988,1987,1986,1985,1984,1983,1982,1981,1980,1979,1978,1977,1976,1975,1974,1973,1972,1971,1970,1969,1968,1967,1966,1965,1964,1963,1962,1961
This statistics in other country:
AfghanistanAlbaniaAlgeriaAndorraAngolaAntigua and BarbudaArab WorldArgentinaArmeniaArubaAustraliaAustriaAzerbaijanBahamas, TheBahrainBangladeshBarbadosBelarusBelgiumBelizeBeninBermudaBhutanBoliviaBosnia and HerzegovinaBotswanaBrazilBritish Virgin IslandsBrunei DarussalamBulgariaBurkina FasoBurundiCabo VerdeCambodiaCameroonCanadaCaribbean small statesCayman IslandsCentral African RepublicCentral Europe and the BalticsChadChileChinaColombiaComorosCongo, Dem. Rep.Congo, Rep.Costa RicaCote d'IvoireCroatiaCubaCuracaoCyprusCzech RepublicDenmarkDjiboutiDominicaDominican RepublicEarly-demographic dividendEast Asia & PacificEast Asia & Pacific (excluding high income)East Asia & Pacific (IDA & IBRD countries)EcuadorEgypt, Arab Rep.El SalvadorEquatorial GuineaEritreaEstoniaEthiopiaEuro areaEurope & Central AsiaEurope & Central Asia (excluding high income)Europe & Central Asia (IDA & IBRD countries)European UnionFaroe IslandsFijiFinlandFragile and conflict affected situationsFranceFrench PolynesiaGabonGambia, TheGeorgiaGermanyGhanaGibraltarGreeceGreenlandGrenadaGuatemalaGuineaGuinea-BissauGuyanaHaitiHeavily indebted poor countries (HIPC)High incomeHondurasHong Kong SAR, ChinaHungaryIBRD onlyIcelandIDA & IBRD totalIDA blendIDA onlyIDA totalIndiaIndonesiaIran, Islamic Rep.IraqIrelandIsraelItalyJamaicaJapanJordanKazakhstanKenyaKiribatiKorea, Dem. People’s Rep.Korea, Rep.KuwaitKyrgyz RepublicLao PDRLate-demographic dividendLatin America & Caribbean Latin America & Caribbean (excluding high income)Latin America & the Caribbean (IDA & IBRD countries)LatviaLeast developed countries: UN classificationLebanonLesothoLiberiaLibyaLiechtensteinLithuaniaLow & middle incomeLow incomeLower middle incomeLuxembourgMacao SAR, ChinaMacedonia, FYRMadagascarMalawiMalaysiaMaldivesMaliMaltaMarshall IslandsMauritaniaMauritiusMexicoMicronesia, Fed. Sts.Middle East & North AfricaMiddle East & North Africa (excluding high income)Middle East & North Africa (IDA & IBRD countries)Middle incomeMoldovaMongoliaMontenegroMoroccoMozambiqueMyanmarNamibiaNauruNepalNetherlandsNew CaledoniaNew ZealandNicaraguaNigerNigeriaNorth AmericaNorwayOECD membersOmanOther small statesPacific island small statesPakistanPalauPanamaPapua New GuineaParaguayPeruPhilippinesPolandPortugalPost-demographic dividendPre-demographic dividendQatarRomaniaRussian FederationRwandaSamoaSao Tome and PrincipeSaudi ArabiaSenegalSerbiaSeychellesSierra LeoneSingaporeSint Maarten (Dutch part)Slovak RepublicSloveniaSmall statesSolomon IslandsSomaliaSouth AfricaSouth AsiaSouth Asia (IDA & IBRD)South SudanSpainSri LankaSt. Kitts and NevisSt. LuciaSt. Vincent and the GrenadinesSub-Saharan Africa Sub-Saharan Africa (excluding high income)Sub-Saharan Africa (IDA & IBRD countries)SudanSurinameSwazilandSwedenSwitzerlandSyrian Arab RepublicTajikistanTanzaniaThailandTimor-LesteTogoTongaTrinidad and TobagoTunisiaTurkeyTurkmenistanTurks and Caicos IslandsUgandaUkraineUnited Arab EmiratesUnited KingdomUnited StatesUpper middle incomeUruguayUzbekistanVanuatuVenezuela, RBVietnamWest Bank and GazaWorldYemen, Rep.ZambiaZimbabwe Timeline:
This timeline shows a graph from 1961 to 2014 of Nepal. No data until 1960. Number of actual observations by date: 54.
Source name:
World Development Indicators
Source organization:
Carbon Dioxide Information Analysis Center, Environmental Sciences Division, Oak Ridge National Laboratory, Tennessee, United States.
Categories, topics:
Climate Change, Environment
Last updated:
apr 23, 2017
Indicators value changes by year
At the date of observation
Value
Absolute change
Change from previous value
jan 1, 1961
100.0
+100.0
0.0%
jan 1, 1962
100.0
0.0
0.0%
jan 1, 1963
100.0
0.0
0.0%
jan 1, 1964
100.0
0.0
0.0%
jan 1, 1965
80.488
-19.512
-19.51%
jan 1, 1966
81.633
+1.145
1.42%
jan 1, 1967
82.692
+1.06
1.3%
jan 1, 1968
75.862
-6.83
-8.26%
jan 1, 1969
76.812
+0.95
1.25%
jan 1, 1970
83.486
+6.675
8.69%
jan 1, 1971
88.71
+5.223
6.26%
jan 1, 1972
83.333
-5.376
-6.06%
jan 1, 1973
76.712
-6.621
-7.95%
jan 1, 1974
51.304
-25.408
-33.12%
jan 1, 1975
45.69
-5.615
-10.94%
jan 1, 1976
63.542
+17.852
39.07%
jan 1, 1977
87.013
+23.471
36.94%
jan 1, 1978
78.261
-8.752
-10.06%
jan 1, 1979
82.222
+3.961
5.06%
jan 1, 1980
60.714
-21.508
-26.16%
jan 1, 1981
58.784
-1.931
-3.18%
jan 1, 1982
73.387
+14.603
24.84%
jan 1, 1983
72.727
-0.66
-0.9%
jan 1, 1984
73.333
+0.606
0.83%
jan 1, 1985
59.375
-13.958
-19.03%
jan 1, 1986
66.486
+7.111
11.98%
jan 1, 1987
73.438
+6.951
10.45%
jan 1, 1988
64.706
-8.732
-11.89%
jan 1, 1989
65.314
+0.608
0.94%
jan 1, 1990
64.257
-1.057
-1.62%
jan 1, 1991
85.549
+21.292
33.14%
jan 1, 1992
74.809
-10.74
-12.55%
jan 1, 1993
68.871
-5.939
-7.94%
jan 1, 1994
71.5
+2.629
3.82%
jan 1, 1995
72.57
+1.07
1.5%
jan 1, 1996
75.315
+2.745
3.78%
jan 1, 1997
64.012
-11.304
-15.01%
jan 1, 1998
66.798
+2.787
4.35%
jan 1, 1999
80.13
+13.332
19.96%
jan 1, 2000
61.048
-19.082
-23.81%
jan 1, 2001
63.202
+2.154
3.53%
jan 1, 2002
61.392
-1.81
-2.86%
jan 1, 2003
74.721
+13.329
21.71%
jan 1, 2004
71.484
-3.237
-4.33%
jan 1, 2005
72.802
+1.318
1.84%
jan 1, 2006
64.923
-7.879
-10.82%
jan 1, 2007
71.245
+6.322
9.74%
jan 1, 2008
65.778
-5.466
-7.67%
jan 1, 2009
73.955
+8.177
12.43%
jan 1, 2010
69.966
-3.989
-5.39%
jan 1, 2011
64.757
-5.209
-7.45%
jan 1, 2012
60.901
-3.856
-5.95%
jan 1, 2013
62.798
+1.897
3.11%
jan 1, 2014
61.027
-1.771
-2.82%
Ranking of countries by current statistics by years


Comments: