29
/
en
AIzaSyAYiBZKx7MnpbEhh9jyipgxe19OcubqV5w
April 1, 2024
77974
Bangladesh
BGD
true
2
1
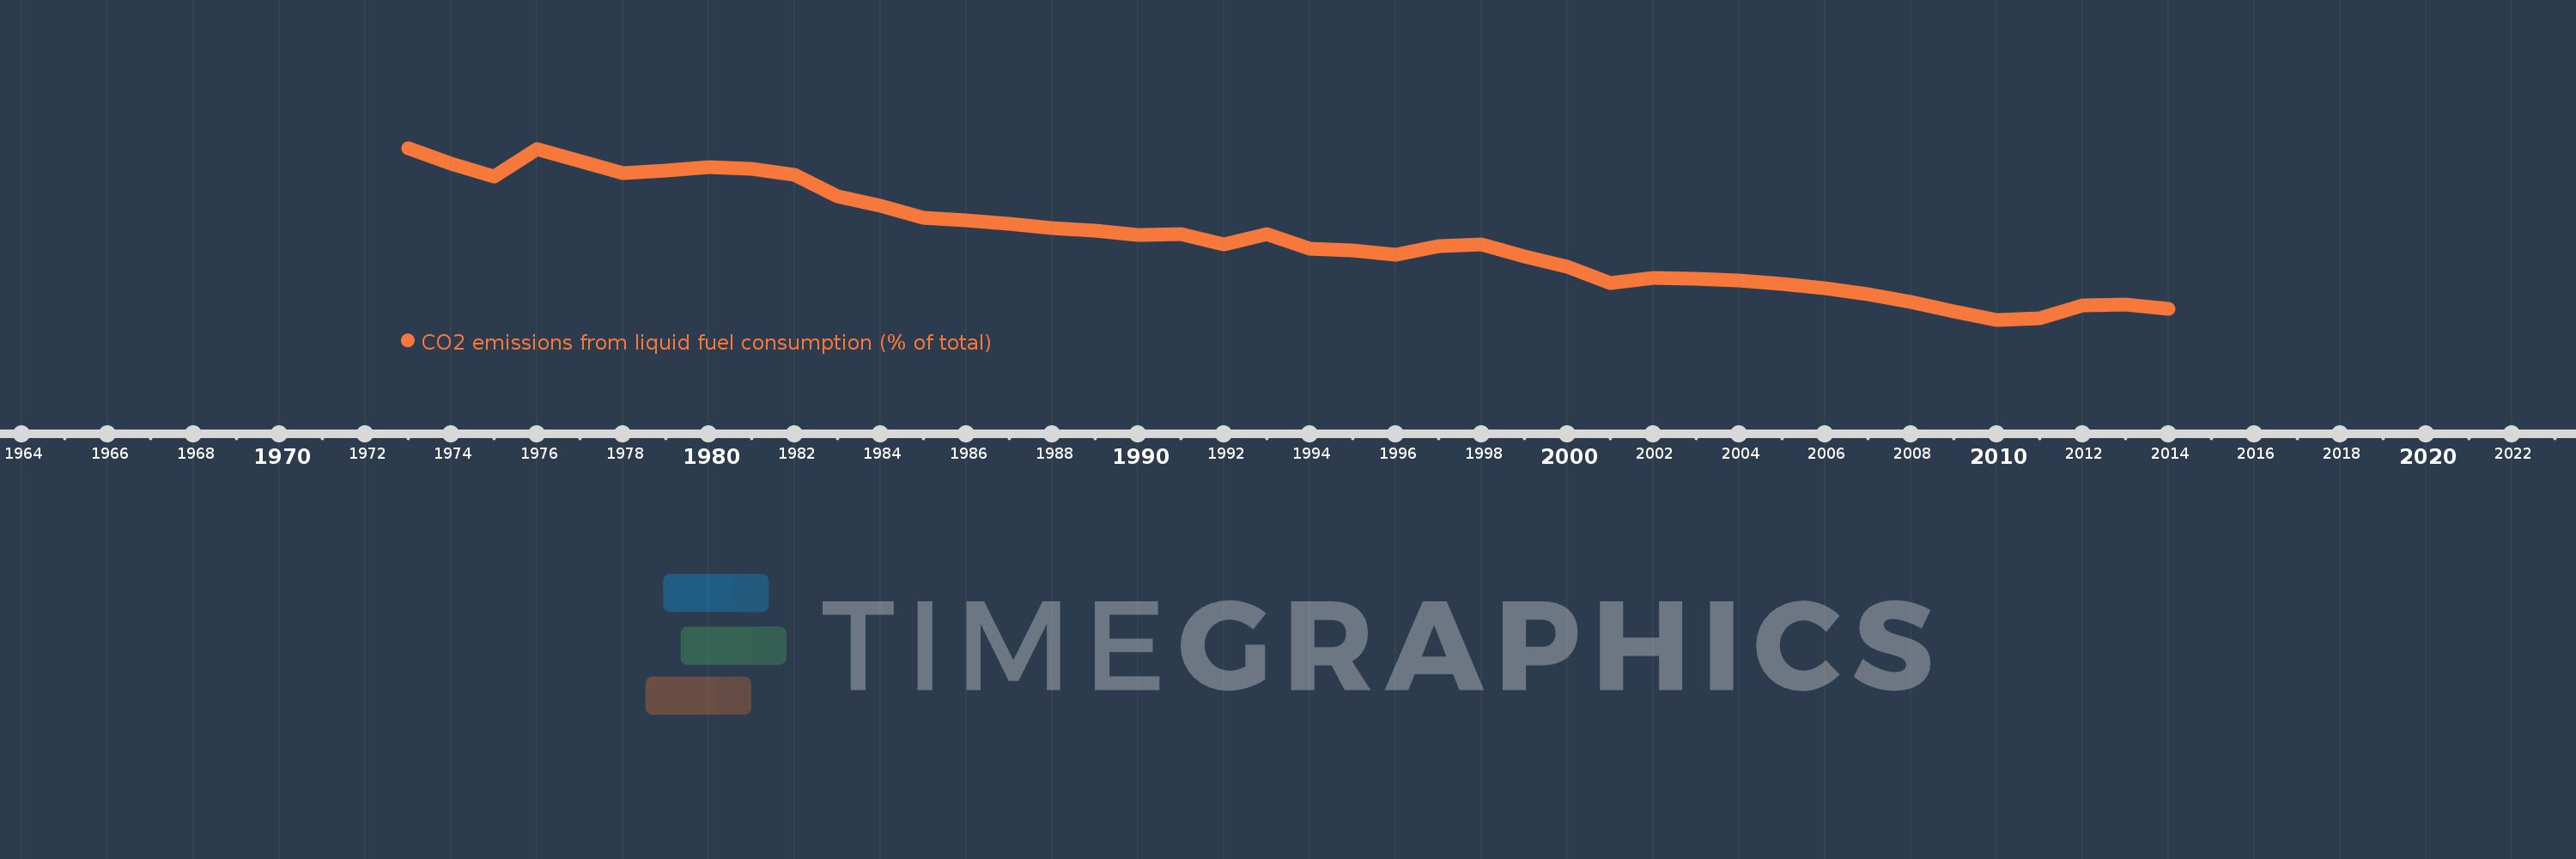
CO2 emissions from liquid fuel consumption (% of total)
2014,2013,2012,2011,2010,2009,2008,2007,2006,2005,2004,2003,2002,2001,2000,1999,1998,1997,1996,1995,1994,1993,1992,1991,1990,1989,1988,1987,1986,1985,1984,1983,1982,1981,1980,1979,1978,1977,1976,1975,1974,1973
This statistics in other country:
AfghanistanAlbaniaAlgeriaAndorraAngolaAntigua and BarbudaArab WorldArgentinaArmeniaArubaAustraliaAustriaAzerbaijanBahamas, TheBahrainBangladeshBarbadosBelarusBelgiumBelizeBeninBermudaBhutanBoliviaBosnia and HerzegovinaBotswanaBrazilBritish Virgin IslandsBrunei DarussalamBulgariaBurkina FasoBurundiCabo VerdeCambodiaCameroonCanadaCaribbean small statesCayman IslandsCentral African RepublicCentral Europe and the BalticsChadChileChinaColombiaComorosCongo, Dem. Rep.Congo, Rep.Costa RicaCote d'IvoireCroatiaCubaCuracaoCyprusCzech RepublicDenmarkDjiboutiDominicaDominican RepublicEarly-demographic dividendEast Asia & PacificEast Asia & Pacific (excluding high income)East Asia & Pacific (IDA & IBRD countries)EcuadorEgypt, Arab Rep.El SalvadorEquatorial GuineaEritreaEstoniaEthiopiaEuro areaEurope & Central AsiaEurope & Central Asia (excluding high income)Europe & Central Asia (IDA & IBRD countries)European UnionFaroe IslandsFijiFinlandFragile and conflict affected situationsFranceFrench PolynesiaGabonGambia, TheGeorgiaGermanyGhanaGibraltarGreeceGreenlandGrenadaGuatemalaGuineaGuinea-BissauGuyanaHaitiHeavily indebted poor countries (HIPC)High incomeHondurasHong Kong SAR, ChinaHungaryIBRD onlyIcelandIDA & IBRD totalIDA blendIDA onlyIDA totalIndiaIndonesiaIran, Islamic Rep.IraqIrelandIsraelItalyJamaicaJapanJordanKazakhstanKenyaKiribatiKorea, Dem. People’s Rep.Korea, Rep.KuwaitKyrgyz RepublicLao PDRLate-demographic dividendLatin America & Caribbean Latin America & Caribbean (excluding high income)Latin America & the Caribbean (IDA & IBRD countries)LatviaLeast developed countries: UN classificationLebanonLesothoLiberiaLibyaLiechtensteinLithuaniaLow & middle incomeLow incomeLower middle incomeLuxembourgMacao SAR, ChinaMacedonia, FYRMadagascarMalawiMalaysiaMaldivesMaliMaltaMarshall IslandsMauritaniaMauritiusMexicoMicronesia, Fed. Sts.Middle East & North AfricaMiddle East & North Africa (excluding high income)Middle East & North Africa (IDA & IBRD countries)Middle incomeMoldovaMongoliaMontenegroMoroccoMozambiqueMyanmarNamibiaNauruNepalNetherlandsNew CaledoniaNew ZealandNicaraguaNigerNigeriaNorth AmericaNorwayOECD membersOmanOther small statesPacific island small statesPakistanPalauPanamaPapua New GuineaParaguayPeruPhilippinesPolandPortugalPost-demographic dividendPre-demographic dividendQatarRomaniaRussian FederationRwandaSamoaSao Tome and PrincipeSaudi ArabiaSenegalSerbiaSeychellesSierra LeoneSingaporeSint Maarten (Dutch part)Slovak RepublicSloveniaSmall statesSolomon IslandsSomaliaSouth AfricaSouth AsiaSouth Asia (IDA & IBRD)South SudanSpainSri LankaSt. Kitts and NevisSt. LuciaSt. Vincent and the GrenadinesSub-Saharan Africa Sub-Saharan Africa (excluding high income)Sub-Saharan Africa (IDA & IBRD countries)SudanSurinameSwazilandSwedenSwitzerlandSyrian Arab RepublicTajikistanTanzaniaThailandTimor-LesteTogoTongaTrinidad and TobagoTunisiaTurkeyTurkmenistanTurks and Caicos IslandsUgandaUkraineUnited Arab EmiratesUnited KingdomUnited StatesUpper middle incomeUruguayUzbekistanVanuatuVenezuela, RBVietnamWest Bank and GazaWorldYemen, Rep.ZambiaZimbabwe Timeline:
This timeline shows a graph from 1973 to 2014 of Bangladesh. No data until 1972. Number of actual observations by date: 42.
Source name:
World Development Indicators
Source organization:
Carbon Dioxide Information Analysis Center, Environmental Sciences Division, Oak Ridge National Laboratory, Tennessee, United States.
Categories, topics:
Climate Change, Environment
Last updated:
apr 23, 2017
Indicators value changes by year
Minimum:
17.373
jan 1, 2010
Maximum:
69.175
jan 1, 1973
At the date of observation
Value
Absolute change
Change from previous value
jan 1, 1973
69.175
+69.175
0.0%
jan 1, 1974
64.412
-4.762
-6.88%
jan 1, 1975
60.504
-3.909
-6.07%
jan 1, 1976
68.75
+8.246
13.63%
jan 1, 1977
65.174
-3.576
-5.2%
jan 1, 1978
61.514
-3.66
-5.62%
jan 1, 1979
62.34
+0.826
1.34%
jan 1, 1980
63.32
+0.98
1.57%
jan 1, 1981
62.938
-0.382
-0.6%
jan 1, 1982
61.165
-1.773
-2.82%
jan 1, 1983
54.712
-6.453
-10.55%
jan 1, 1984
51.647
-3.065
-5.6%
jan 1, 1985
48.232
-3.416
-6.61%
jan 1, 1986
47.295
-0.937
-1.94%
jan 1, 1987
46.193
-1.102
-2.33%
jan 1, 1988
44.946
-1.247
-2.7%
jan 1, 1989
44.342
-0.604
-1.34%
jan 1, 1990
42.9
-1.442
-3.25%
jan 1, 1991
43.201
+0.301
0.7%
jan 1, 1992
40.143
-3.059
-7.08%
jan 1, 1993
43.244
+3.101
7.73%
jan 1, 1994
38.782
-4.461
-10.32%
jan 1, 1995
38.218
-0.565
-1.46%
jan 1, 1996
36.901
-1.316
-3.44%
jan 1, 1997
39.615
+2.714
7.36%
jan 1, 1998
40.132
+0.516
1.3%
jan 1, 1999
36.337
-3.794
-9.45%
jan 1, 2000
33.246
-3.091
-8.51%
jan 1, 2001
28.474
-4.772
-14.35%
jan 1, 2002
29.918
+1.444
5.07%
jan 1, 2003
29.613
-0.305
-1.02%
jan 1, 2004
29.163
-0.449
-1.52%
jan 1, 2005
28.244
-0.92
-3.15%
jan 1, 2006
26.816
-1.428
-5.05%
jan 1, 2007
25.046
-1.77
-6.6%
jan 1, 2008
22.626
-2.42
-9.66%
jan 1, 2009
19.882
-2.744
-12.13%
jan 1, 2010
17.373
-2.509
-12.62%
jan 1, 2011
17.702
+0.329
1.89%
jan 1, 2012
21.626
+3.924
22.17%
jan 1, 2013
21.97
+0.345
1.59%
jan 1, 2014
20.747
-1.224
-5.57%
Ranking of countries by current statistics by years


Comments: