29
/
en
AIzaSyAYiBZKx7MnpbEhh9jyipgxe19OcubqV5w
April 1, 2024
209132
New Zealand
NZL
true
2
1
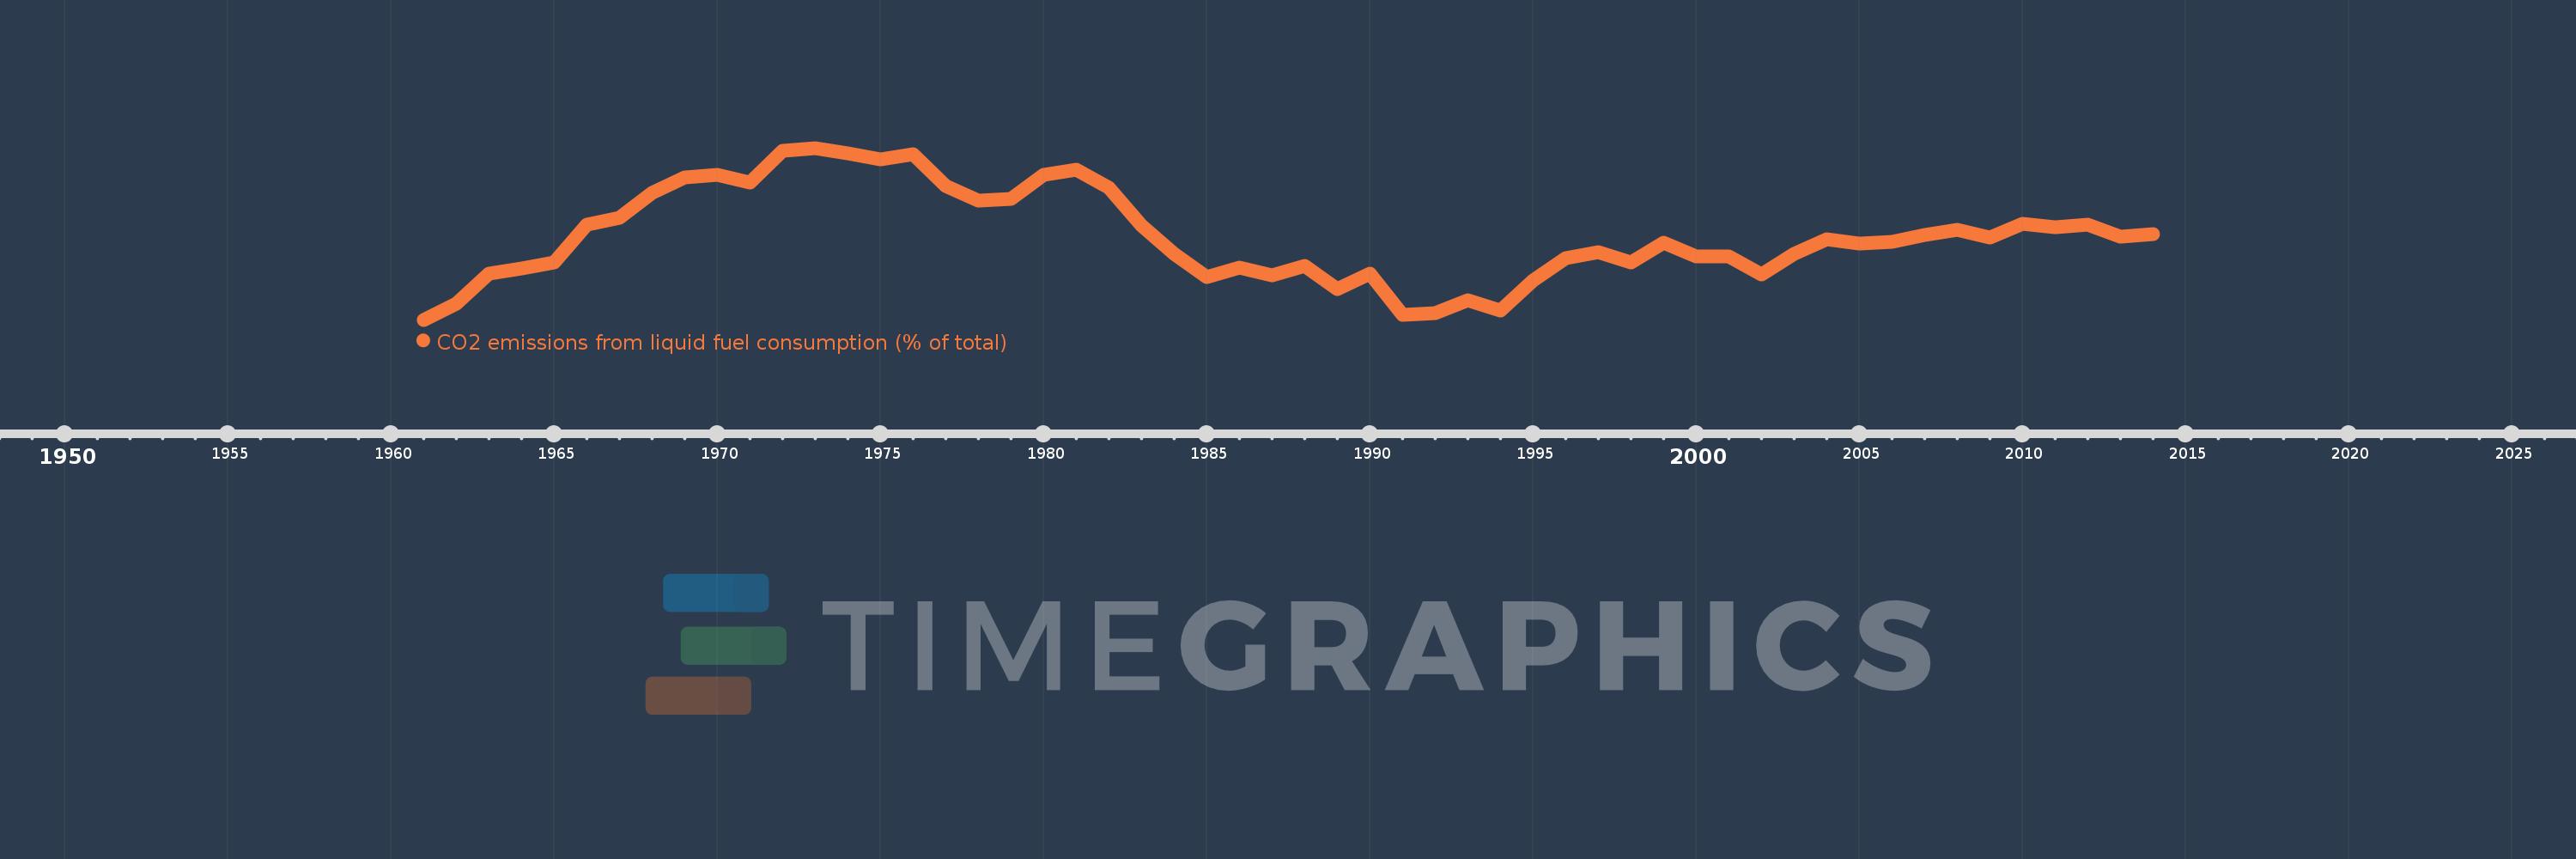
CO2 emissions from liquid fuel consumption (% of total)
2014,2013,2012,2011,2010,2009,2008,2007,2006,2005,2004,2003,2002,2001,2000,1999,1998,1997,1996,1995,1994,1993,1992,1991,1990,1989,1988,1987,1986,1985,1984,1983,1982,1981,1980,1979,1978,1977,1976,1975,1974,1973,1972,1971,1970,1969,1968,1967,1966,1965,1964,1963,1962,1961
This statistics in other country:
AfghanistanAlbaniaAlgeriaAndorraAngolaAntigua and BarbudaArab WorldArgentinaArmeniaArubaAustraliaAustriaAzerbaijanBahamas, TheBahrainBangladeshBarbadosBelarusBelgiumBelizeBeninBermudaBhutanBoliviaBosnia and HerzegovinaBotswanaBrazilBritish Virgin IslandsBrunei DarussalamBulgariaBurkina FasoBurundiCabo VerdeCambodiaCameroonCanadaCaribbean small statesCayman IslandsCentral African RepublicCentral Europe and the BalticsChadChileChinaColombiaComorosCongo, Dem. Rep.Congo, Rep.Costa RicaCote d'IvoireCroatiaCubaCuracaoCyprusCzech RepublicDenmarkDjiboutiDominicaDominican RepublicEarly-demographic dividendEast Asia & PacificEast Asia & Pacific (excluding high income)East Asia & Pacific (IDA & IBRD countries)EcuadorEgypt, Arab Rep.El SalvadorEquatorial GuineaEritreaEstoniaEthiopiaEuro areaEurope & Central AsiaEurope & Central Asia (excluding high income)Europe & Central Asia (IDA & IBRD countries)European UnionFaroe IslandsFijiFinlandFragile and conflict affected situationsFranceFrench PolynesiaGabonGambia, TheGeorgiaGermanyGhanaGibraltarGreeceGreenlandGrenadaGuatemalaGuineaGuinea-BissauGuyanaHaitiHeavily indebted poor countries (HIPC)High incomeHondurasHong Kong SAR, ChinaHungaryIBRD onlyIcelandIDA & IBRD totalIDA blendIDA onlyIDA totalIndiaIndonesiaIran, Islamic Rep.IraqIrelandIsraelItalyJamaicaJapanJordanKazakhstanKenyaKiribatiKorea, Dem. People’s Rep.Korea, Rep.KuwaitKyrgyz RepublicLao PDRLate-demographic dividendLatin America & Caribbean Latin America & Caribbean (excluding high income)Latin America & the Caribbean (IDA & IBRD countries)LatviaLeast developed countries: UN classificationLebanonLesothoLiberiaLibyaLiechtensteinLithuaniaLow & middle incomeLow incomeLower middle incomeLuxembourgMacao SAR, ChinaMacedonia, FYRMadagascarMalawiMalaysiaMaldivesMaliMaltaMarshall IslandsMauritaniaMauritiusMexicoMicronesia, Fed. Sts.Middle East & North AfricaMiddle East & North Africa (excluding high income)Middle East & North Africa (IDA & IBRD countries)Middle incomeMoldovaMongoliaMontenegroMoroccoMozambiqueMyanmarNamibiaNauruNepalNetherlandsNew CaledoniaNew ZealandNicaraguaNigerNigeriaNorth AmericaNorwayOECD membersOmanOther small statesPacific island small statesPakistanPalauPanamaPapua New GuineaParaguayPeruPhilippinesPolandPortugalPost-demographic dividendPre-demographic dividendQatarRomaniaRussian FederationRwandaSamoaSao Tome and PrincipeSaudi ArabiaSenegalSerbiaSeychellesSierra LeoneSingaporeSint Maarten (Dutch part)Slovak RepublicSloveniaSmall statesSolomon IslandsSomaliaSouth AfricaSouth AsiaSouth Asia (IDA & IBRD)South SudanSpainSri LankaSt. Kitts and NevisSt. LuciaSt. Vincent and the GrenadinesSub-Saharan Africa Sub-Saharan Africa (excluding high income)Sub-Saharan Africa (IDA & IBRD countries)SudanSurinameSwazilandSwedenSwitzerlandSyrian Arab RepublicTajikistanTanzaniaThailandTimor-LesteTogoTongaTrinidad and TobagoTunisiaTurkeyTurkmenistanTurks and Caicos IslandsUgandaUkraineUnited Arab EmiratesUnited KingdomUnited StatesUpper middle incomeUruguayUzbekistanVanuatuVenezuela, RBVietnamWest Bank and GazaWorldYemen, Rep.ZambiaZimbabwe Timeline:
This timeline shows a graph from 1961 to 2014 of New Zealand. No data until 1960. Number of actual observations by date: 54.
Source name:
World Development Indicators
Source organization:
Carbon Dioxide Information Analysis Center, Environmental Sciences Division, Oak Ridge National Laboratory, Tennessee, United States.
Categories, topics:
Climate Change, Environment
Last updated:
apr 23, 2017
Indicators value changes by year
Minimum:
40.152
jan 1, 1961
Maximum:
65.588
jan 1, 1973
At the date of observation
Value
Absolute change
Change from previous value
jan 1, 1961
40.152
+40.152
0.0%
jan 1, 1962
42.505
+2.353
5.86%
jan 1, 1963
47.007
+4.501
10.59%
jan 1, 1964
47.796
+0.789
1.68%
jan 1, 1965
48.601
+0.805
1.68%
jan 1, 1966
54.229
+5.628
11.58%
jan 1, 1967
55.285
+1.056
1.95%
jan 1, 1968
58.978
+3.693
6.68%
jan 1, 1969
61.283
+2.305
3.91%
jan 1, 1970
61.639
+0.356
0.58%
jan 1, 1971
60.424
-1.216
-1.97%
jan 1, 1972
65.206
+4.782
7.91%
jan 1, 1973
65.588
+0.382
0.59%
jan 1, 1974
64.786
-0.801
-1.22%
jan 1, 1975
63.91
-0.876
-1.35%
jan 1, 1976
64.618
+0.708
1.11%
jan 1, 1977
59.989
-4.63
-7.16%
jan 1, 1978
57.749
-2.239
-3.73%
jan 1, 1979
58.094
+0.345
0.6%
jan 1, 1980
61.629
+3.535
6.09%
jan 1, 1981
62.34
+0.711
1.15%
jan 1, 1982
59.641
-2.699
-4.33%
jan 1, 1983
54.121
-5.519
-9.25%
jan 1, 1984
49.949
-4.172
-7.71%
jan 1, 1985
46.484
-3.465
-6.94%
jan 1, 1986
47.83
+1.346
2.9%
jan 1, 1987
46.756
-1.074
-2.25%
jan 1, 1988
48.137
+1.381
2.95%
jan 1, 1989
44.701
-3.436
-7.14%
jan 1, 1990
47.041
+2.34
5.23%
jan 1, 1991
40.897
-6.144
-13.06%
jan 1, 1992
41.139
+0.242
0.59%
jan 1, 1993
42.982
+1.844
4.48%
jan 1, 1994
41.467
-1.515
-3.52%
jan 1, 1995
45.959
+4.492
10.83%
jan 1, 1996
49.277
+3.318
7.22%
jan 1, 1997
50.186
+0.909
1.84%
jan 1, 1998
48.605
-1.58
-3.15%
jan 1, 1999
51.533
+2.927
6.02%
jan 1, 2000
49.489
-2.044
-3.97%
jan 1, 2001
49.566
+0.078
0.16%
jan 1, 2002
46.849
-2.717
-5.48%
jan 1, 2003
49.912
+3.063
6.54%
jan 1, 2004
52.055
+2.143
4.29%
jan 1, 2005
51.459
-0.596
-1.14%
jan 1, 2006
51.665
+0.206
0.4%
jan 1, 2007
52.692
+1.027
1.99%
jan 1, 2008
53.483
+0.791
1.5%
jan 1, 2009
52.343
-1.14
-2.13%
jan 1, 2010
54.337
+1.994
3.81%
jan 1, 2011
53.9
-0.436
-0.8%
jan 1, 2012
54.254
+0.354
0.66%
jan 1, 2013
52.508
-1.746
-3.22%
jan 1, 2014
52.888
+0.38
0.72%
Ranking of countries by current statistics by years


Comments: