29
/
en
AIzaSyAYiBZKx7MnpbEhh9jyipgxe19OcubqV5w
April 1, 2024
261987
Thailand
THA
true
2
1
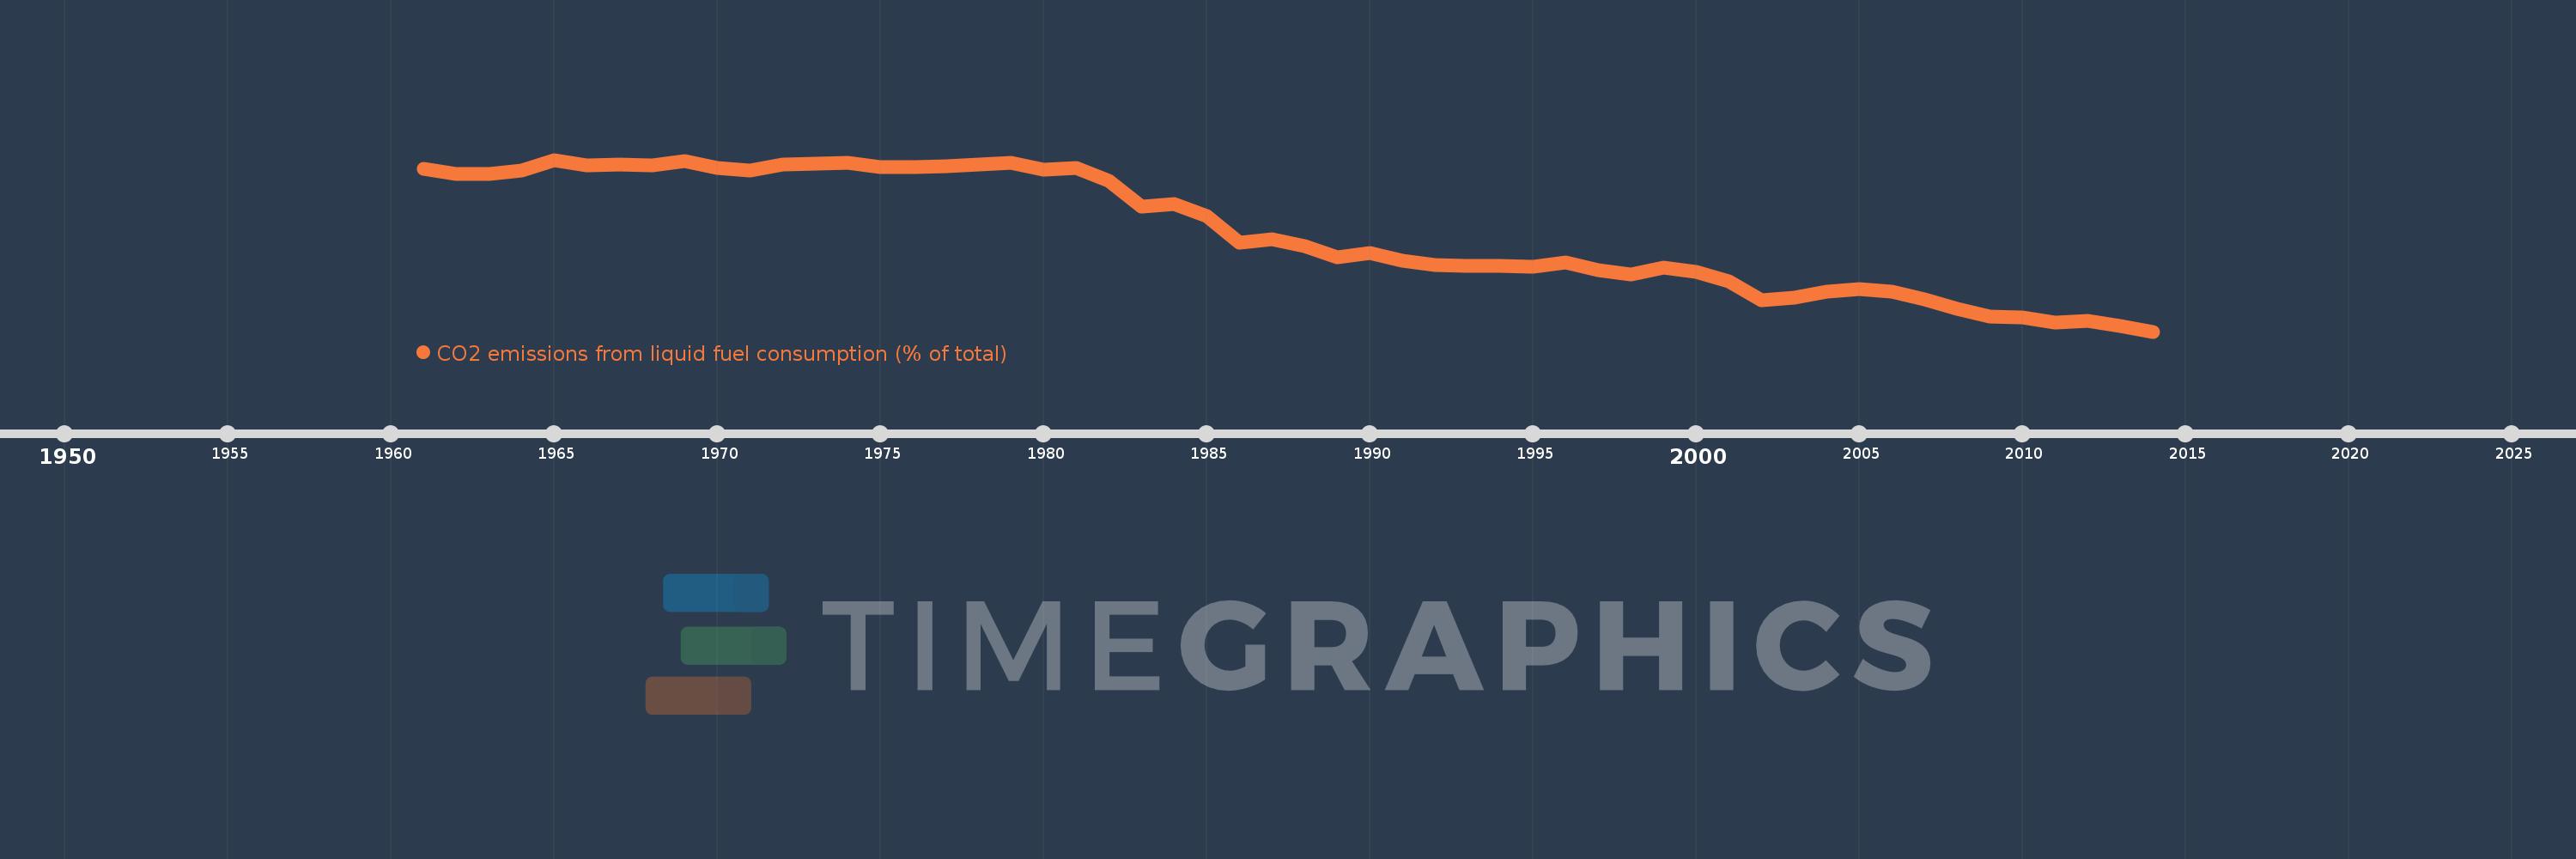
CO2 emissions from liquid fuel consumption (% of total)
2014,2013,2012,2011,2010,2009,2008,2007,2006,2005,2004,2003,2002,2001,2000,1999,1998,1997,1996,1995,1994,1993,1992,1991,1990,1989,1988,1987,1986,1985,1984,1983,1982,1981,1980,1979,1978,1977,1976,1975,1974,1973,1972,1971,1970,1969,1968,1967,1966,1965,1964,1963,1962,1961
This statistics in other country:
AfghanistanAlbaniaAlgeriaAndorraAngolaAntigua and BarbudaArab WorldArgentinaArmeniaArubaAustraliaAustriaAzerbaijanBahamas, TheBahrainBangladeshBarbadosBelarusBelgiumBelizeBeninBermudaBhutanBoliviaBosnia and HerzegovinaBotswanaBrazilBritish Virgin IslandsBrunei DarussalamBulgariaBurkina FasoBurundiCabo VerdeCambodiaCameroonCanadaCaribbean small statesCayman IslandsCentral African RepublicCentral Europe and the BalticsChadChileChinaColombiaComorosCongo, Dem. Rep.Congo, Rep.Costa RicaCote d'IvoireCroatiaCubaCuracaoCyprusCzech RepublicDenmarkDjiboutiDominicaDominican RepublicEarly-demographic dividendEast Asia & PacificEast Asia & Pacific (excluding high income)East Asia & Pacific (IDA & IBRD countries)EcuadorEgypt, Arab Rep.El SalvadorEquatorial GuineaEritreaEstoniaEthiopiaEuro areaEurope & Central AsiaEurope & Central Asia (excluding high income)Europe & Central Asia (IDA & IBRD countries)European UnionFaroe IslandsFijiFinlandFragile and conflict affected situationsFranceFrench PolynesiaGabonGambia, TheGeorgiaGermanyGhanaGibraltarGreeceGreenlandGrenadaGuatemalaGuineaGuinea-BissauGuyanaHaitiHeavily indebted poor countries (HIPC)High incomeHondurasHong Kong SAR, ChinaHungaryIBRD onlyIcelandIDA & IBRD totalIDA blendIDA onlyIDA totalIndiaIndonesiaIran, Islamic Rep.IraqIrelandIsraelItalyJamaicaJapanJordanKazakhstanKenyaKiribatiKorea, Dem. People’s Rep.Korea, Rep.KuwaitKyrgyz RepublicLao PDRLate-demographic dividendLatin America & Caribbean Latin America & Caribbean (excluding high income)Latin America & the Caribbean (IDA & IBRD countries)LatviaLeast developed countries: UN classificationLebanonLesothoLiberiaLibyaLiechtensteinLithuaniaLow & middle incomeLow incomeLower middle incomeLuxembourgMacao SAR, ChinaMacedonia, FYRMadagascarMalawiMalaysiaMaldivesMaliMaltaMarshall IslandsMauritaniaMauritiusMexicoMicronesia, Fed. Sts.Middle East & North AfricaMiddle East & North Africa (excluding high income)Middle East & North Africa (IDA & IBRD countries)Middle incomeMoldovaMongoliaMontenegroMoroccoMozambiqueMyanmarNamibiaNauruNepalNetherlandsNew CaledoniaNew ZealandNicaraguaNigerNigeriaNorth AmericaNorwayOECD membersOmanOther small statesPacific island small statesPakistanPalauPanamaPapua New GuineaParaguayPeruPhilippinesPolandPortugalPost-demographic dividendPre-demographic dividendQatarRomaniaRussian FederationRwandaSamoaSao Tome and PrincipeSaudi ArabiaSenegalSerbiaSeychellesSierra LeoneSingaporeSint Maarten (Dutch part)Slovak RepublicSloveniaSmall statesSolomon IslandsSomaliaSouth AfricaSouth AsiaSouth Asia (IDA & IBRD)South SudanSpainSri LankaSt. Kitts and NevisSt. LuciaSt. Vincent and the GrenadinesSub-Saharan Africa Sub-Saharan Africa (excluding high income)Sub-Saharan Africa (IDA & IBRD countries)SudanSurinameSwazilandSwedenSwitzerlandSyrian Arab RepublicTajikistanTanzaniaThailandTimor-LesteTogoTongaTrinidad and TobagoTunisiaTurkeyTurkmenistanTurks and Caicos IslandsUgandaUkraineUnited Arab EmiratesUnited KingdomUnited StatesUpper middle incomeUruguayUzbekistanVanuatuVenezuela, RBVietnamWest Bank and GazaWorldYemen, Rep.ZambiaZimbabwe Timeline:
This timeline shows a graph from 1961 to 2014 of Thailand. No data until 1960. Number of actual observations by date: 54.
Source name:
World Development Indicators
Source organization:
Carbon Dioxide Information Analysis Center, Environmental Sciences Division, Oak Ridge National Laboratory, Tennessee, United States.
Categories, topics:
Climate Change, Environment
Last updated:
apr 23, 2017
Indicators value changes by year
Minimum:
42.625
jan 1, 2014
Maximum:
91.422
jan 1, 1965
At the date of observation
Value
Absolute change
Change from previous value
jan 1, 1961
88.944
+88.944
0.0%
jan 1, 1962
87.356
-1.587
-1.78%
jan 1, 1963
87.473
+0.116
0.13%
jan 1, 1964
88.413
+0.941
1.08%
jan 1, 1965
91.422
+3.008
3.4%
jan 1, 1966
89.715
-1.707
-1.87%
jan 1, 1967
90.135
+0.421
0.47%
jan 1, 1968
89.843
-0.292
-0.32%
jan 1, 1969
91.057
+1.214
1.35%
jan 1, 1970
89.071
-1.986
-2.18%
jan 1, 1971
88.481
-0.59
-0.66%
jan 1, 1972
90.036
+1.555
1.76%
jan 1, 1973
90.395
+0.358
0.4%
jan 1, 1974
90.628
+0.234
0.26%
jan 1, 1975
89.428
-1.2
-1.32%
jan 1, 1976
89.303
-0.125
-0.14%
jan 1, 1977
89.704
+0.401
0.45%
jan 1, 1978
90.125
+0.421
0.47%
jan 1, 1979
90.505
+0.38
0.42%
jan 1, 1980
88.67
-1.835
-2.03%
jan 1, 1981
89.054
+0.384
0.43%
jan 1, 1982
85.457
-3.598
-4.04%
jan 1, 1983
78.052
-7.405
-8.67%
jan 1, 1984
78.751
+0.699
0.9%
jan 1, 1985
75.345
-3.406
-4.33%
jan 1, 1986
67.912
-7.433
-9.86%
jan 1, 1987
68.873
+0.96
1.41%
jan 1, 1988
66.881
-1.991
-2.89%
jan 1, 1989
63.671
-3.21
-4.8%
jan 1, 1990
64.902
+1.231
1.93%
jan 1, 1991
62.82
-2.082
-3.21%
jan 1, 1992
61.46
-1.359
-2.16%
jan 1, 1993
61.376
-0.085
-0.14%
jan 1, 1994
61.396
+0.02
0.03%
jan 1, 1995
61.024
-0.372
-0.61%
jan 1, 1996
62.148
+1.124
1.84%
jan 1, 1997
60.17
-1.978
-3.18%
jan 1, 1998
58.828
-1.341
-2.23%
jan 1, 1999
60.732
+1.904
3.24%
jan 1, 2000
59.471
-1.261
-2.08%
jan 1, 2001
56.806
-2.665
-4.48%
jan 1, 2002
51.619
-5.188
-9.13%
jan 1, 2003
52.223
+0.605
1.17%
jan 1, 2004
54.067
+1.844
3.53%
jan 1, 2005
54.738
+0.67
1.24%
jan 1, 2006
53.853
-0.884
-1.62%
jan 1, 2007
51.807
-2.047
-3.8%
jan 1, 2008
49.035
-2.772
-5.35%
jan 1, 2009
46.981
-2.054
-4.19%
jan 1, 2010
46.642
-0.338
-0.72%
jan 1, 2011
45.153
-1.489
-3.19%
jan 1, 2012
45.699
+0.546
1.21%
jan 1, 2013
44.277
-1.422
-3.11%
jan 1, 2014
42.625
-1.652
-3.73%
Ranking of countries by current statistics by years


Comments: