29
/
en
AIzaSyAYiBZKx7MnpbEhh9jyipgxe19OcubqV5w
April 1, 2024
153361
Iceland
ISL
true
2
1
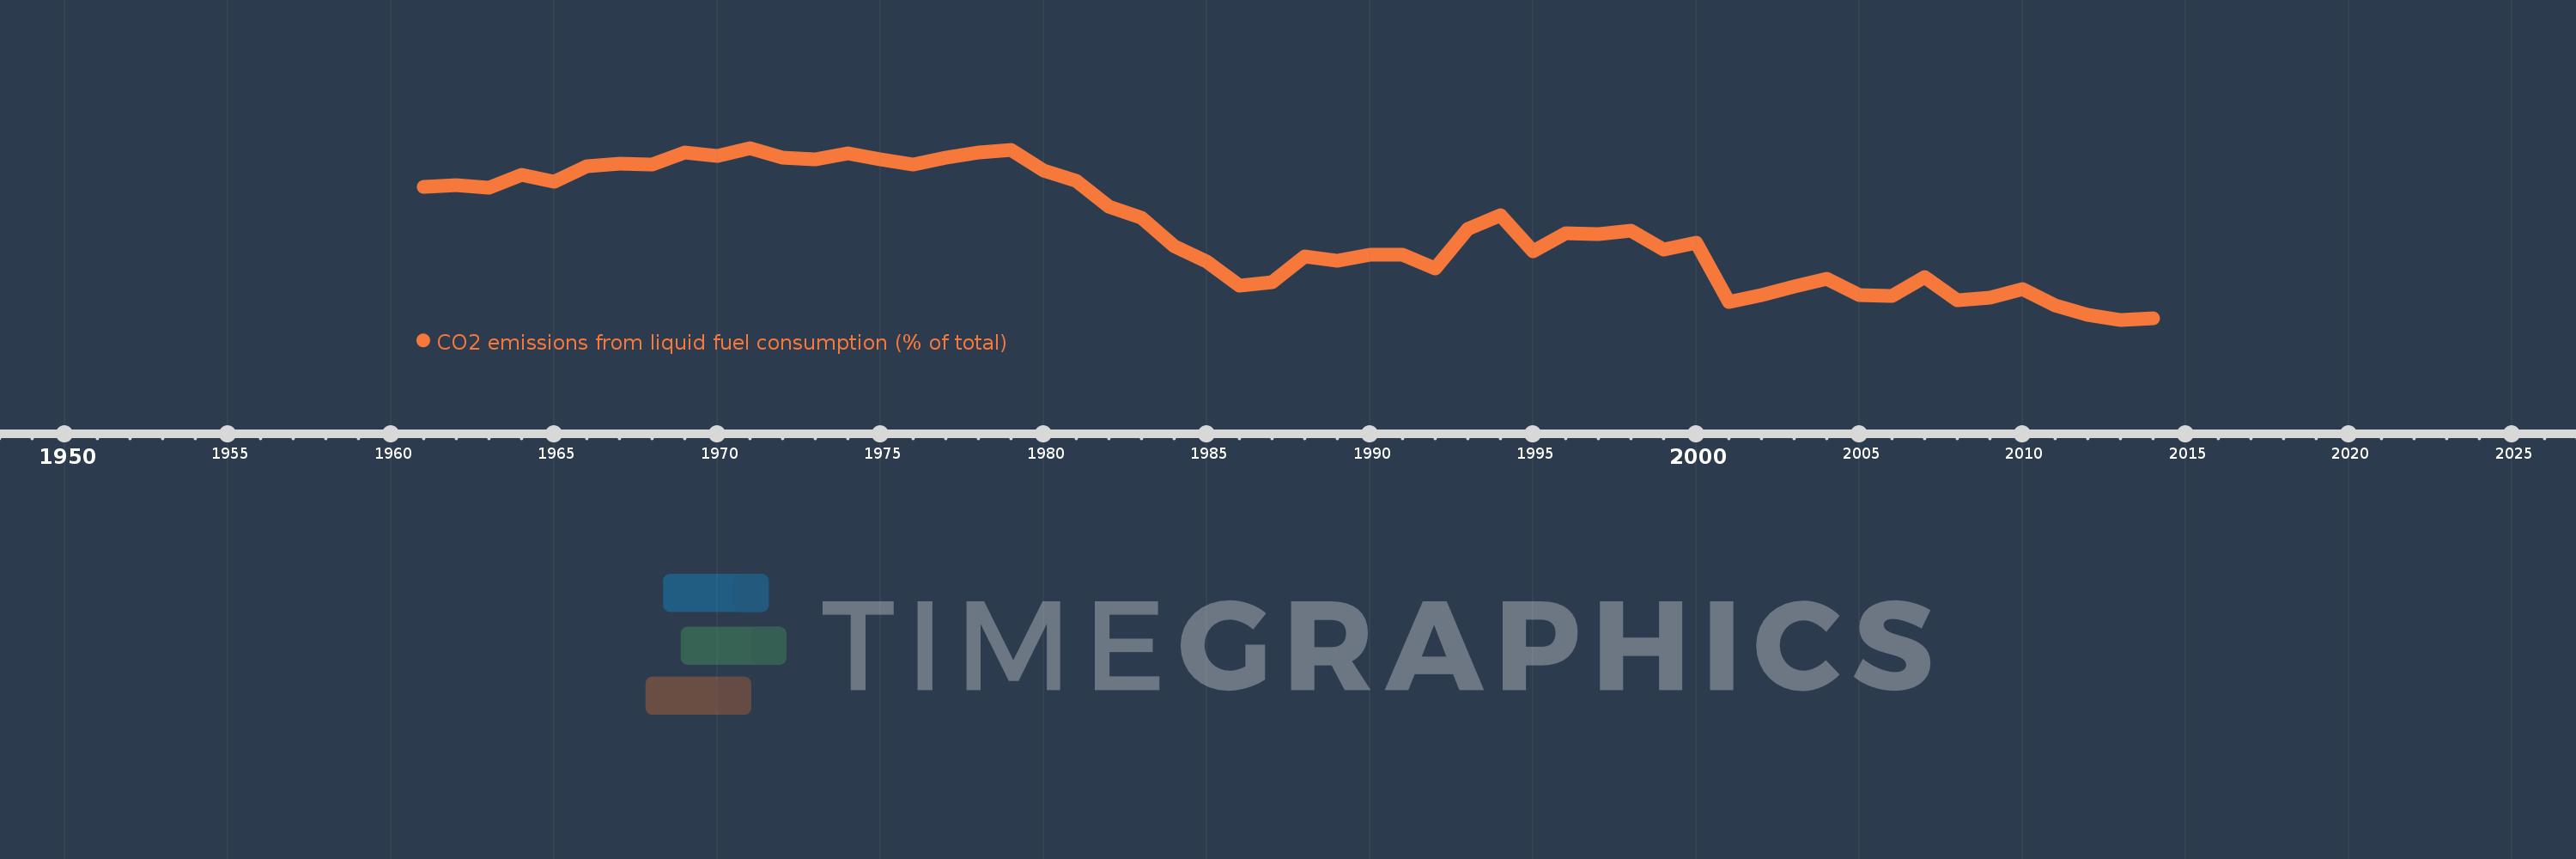
CO2 emissions from liquid fuel consumption (% of total)
2014,2013,2012,2011,2010,2009,2008,2007,2006,2005,2004,2003,2002,2001,2000,1999,1998,1997,1996,1995,1994,1993,1992,1991,1990,1989,1988,1987,1986,1985,1984,1983,1982,1981,1980,1979,1978,1977,1976,1975,1974,1973,1972,1971,1970,1969,1968,1967,1966,1965,1964,1963,1962,1961
This statistics in other country:
AfghanistanAlbaniaAlgeriaAndorraAngolaAntigua and BarbudaArab WorldArgentinaArmeniaArubaAustraliaAustriaAzerbaijanBahamas, TheBahrainBangladeshBarbadosBelarusBelgiumBelizeBeninBermudaBhutanBoliviaBosnia and HerzegovinaBotswanaBrazilBritish Virgin IslandsBrunei DarussalamBulgariaBurkina FasoBurundiCabo VerdeCambodiaCameroonCanadaCaribbean small statesCayman IslandsCentral African RepublicCentral Europe and the BalticsChadChileChinaColombiaComorosCongo, Dem. Rep.Congo, Rep.Costa RicaCote d'IvoireCroatiaCubaCuracaoCyprusCzech RepublicDenmarkDjiboutiDominicaDominican RepublicEarly-demographic dividendEast Asia & PacificEast Asia & Pacific (excluding high income)East Asia & Pacific (IDA & IBRD countries)EcuadorEgypt, Arab Rep.El SalvadorEquatorial GuineaEritreaEstoniaEthiopiaEuro areaEurope & Central AsiaEurope & Central Asia (excluding high income)Europe & Central Asia (IDA & IBRD countries)European UnionFaroe IslandsFijiFinlandFragile and conflict affected situationsFranceFrench PolynesiaGabonGambia, TheGeorgiaGermanyGhanaGibraltarGreeceGreenlandGrenadaGuatemalaGuineaGuinea-BissauGuyanaHaitiHeavily indebted poor countries (HIPC)High incomeHondurasHong Kong SAR, ChinaHungaryIBRD onlyIcelandIDA & IBRD totalIDA blendIDA onlyIDA totalIndiaIndonesiaIran, Islamic Rep.IraqIrelandIsraelItalyJamaicaJapanJordanKazakhstanKenyaKiribatiKorea, Dem. People’s Rep.Korea, Rep.KuwaitKyrgyz RepublicLao PDRLate-demographic dividendLatin America & Caribbean Latin America & Caribbean (excluding high income)Latin America & the Caribbean (IDA & IBRD countries)LatviaLeast developed countries: UN classificationLebanonLesothoLiberiaLibyaLiechtensteinLithuaniaLow & middle incomeLow incomeLower middle incomeLuxembourgMacao SAR, ChinaMacedonia, FYRMadagascarMalawiMalaysiaMaldivesMaliMaltaMarshall IslandsMauritaniaMauritiusMexicoMicronesia, Fed. Sts.Middle East & North AfricaMiddle East & North Africa (excluding high income)Middle East & North Africa (IDA & IBRD countries)Middle incomeMoldovaMongoliaMontenegroMoroccoMozambiqueMyanmarNamibiaNauruNepalNetherlandsNew CaledoniaNew ZealandNicaraguaNigerNigeriaNorth AmericaNorwayOECD membersOmanOther small statesPacific island small statesPakistanPalauPanamaPapua New GuineaParaguayPeruPhilippinesPolandPortugalPost-demographic dividendPre-demographic dividendQatarRomaniaRussian FederationRwandaSamoaSao Tome and PrincipeSaudi ArabiaSenegalSerbiaSeychellesSierra LeoneSingaporeSint Maarten (Dutch part)Slovak RepublicSloveniaSmall statesSolomon IslandsSomaliaSouth AfricaSouth AsiaSouth Asia (IDA & IBRD)South SudanSpainSri LankaSt. Kitts and NevisSt. LuciaSt. Vincent and the GrenadinesSub-Saharan Africa Sub-Saharan Africa (excluding high income)Sub-Saharan Africa (IDA & IBRD countries)SudanSurinameSwazilandSwedenSwitzerlandSyrian Arab RepublicTajikistanTanzaniaThailandTimor-LesteTogoTongaTrinidad and TobagoTunisiaTurkeyTurkmenistanTurks and Caicos IslandsUgandaUkraineUnited Arab EmiratesUnited KingdomUnited StatesUpper middle incomeUruguayUzbekistanVanuatuVenezuela, RBVietnamWest Bank and GazaWorldYemen, Rep.ZambiaZimbabwe Timeline:
This timeline shows a graph from 1961 to 2014 of Iceland. No data until 1960. Number of actual observations by date: 54.
Source name:
World Development Indicators
Source organization:
Carbon Dioxide Information Analysis Center, Environmental Sciences Division, Oak Ridge National Laboratory, Tennessee, United States.
Categories, topics:
Climate Change, Environment
Last updated:
apr 23, 2017
Indicators value changes by year
Minimum:
77.451
jan 1, 2013
Maximum:
96.834
jan 1, 1971
At the date of observation
Value
Absolute change
Change from previous value
jan 1, 1961
92.447
+92.447
0.0%
jan 1, 1962
92.617
+0.17
0.18%
jan 1, 1963
92.355
-0.263
-0.28%
jan 1, 1964
93.82
+1.465
1.59%
jan 1, 1965
92.997
-0.823
-0.88%
jan 1, 1966
94.751
+1.753
1.89%
jan 1, 1967
95.098
+0.347
0.37%
jan 1, 1968
94.924
-0.174
-0.18%
jan 1, 1969
96.322
+1.398
1.47%
jan 1, 1970
95.942
-0.38
-0.39%
jan 1, 1971
96.834
+0.892
0.93%
jan 1, 1972
95.771
-1.063
-1.1%
jan 1, 1973
95.556
-0.216
-0.23%
jan 1, 1974
96.234
+0.679
0.71%
jan 1, 1975
95.579
-0.655
-0.68%
jan 1, 1976
95.011
-0.568
-0.59%
jan 1, 1977
95.699
+0.688
0.72%
jan 1, 1978
96.346
+0.647
0.68%
jan 1, 1979
96.571
+0.225
0.23%
jan 1, 1980
94.28
-2.291
-2.37%
jan 1, 1981
93.124
-1.157
-1.23%
jan 1, 1982
90.167
-2.956
-3.17%
jan 1, 1983
88.991
-1.177
-1.3%
jan 1, 1984
85.782
-3.209
-3.61%
jan 1, 1985
84.04
-1.742
-2.03%
jan 1, 1986
81.306
-2.734
-3.25%
jan 1, 1987
81.725
+0.419
0.51%
jan 1, 1988
84.554
+2.83
3.46%
jan 1, 1989
84.127
-0.427
-0.51%
jan 1, 1990
84.778
+0.651
0.77%
jan 1, 1991
84.771
-0.008
-0.01%
jan 1, 1992
83.195
-1.576
-1.86%
jan 1, 1993
87.702
+4.507
5.42%
jan 1, 1994
89.239
+1.538
1.75%
jan 1, 1995
85.219
-4.02
-4.51%
jan 1, 1996
87.194
+1.975
2.32%
jan 1, 1997
87.065
-0.129
-0.15%
jan 1, 1998
87.456
+0.392
0.45%
jan 1, 1999
85.34
-2.116
-2.42%
jan 1, 2000
86.17
+0.83
0.97%
jan 1, 2001
79.492
-6.679
-7.75%
jan 1, 2002
80.279
+0.788
0.99%
jan 1, 2003
81.25
+0.971
1.21%
jan 1, 2004
82.064
+0.814
1.0%
jan 1, 2005
80.229
-1.836
-2.24%
jan 1, 2006
80.099
-0.13
-0.16%
jan 1, 2007
82.297
+2.198
2.74%
jan 1, 2008
79.683
-2.614
-3.18%
jan 1, 2009
79.931
+0.248
0.31%
jan 1, 2010
80.893
+0.962
1.2%
jan 1, 2011
79.065
-1.827
-2.26%
jan 1, 2012
77.973
-1.093
-1.38%
jan 1, 2013
77.451
-0.522
-0.67%
jan 1, 2014
77.654
+0.203
0.26%
Ranking of countries by current statistics by years


Comments: