29
/
en
AIzaSyAYiBZKx7MnpbEhh9jyipgxe19OcubqV5w
April 1, 2024
286942
Zimbabwe
ZWE
true
2
1
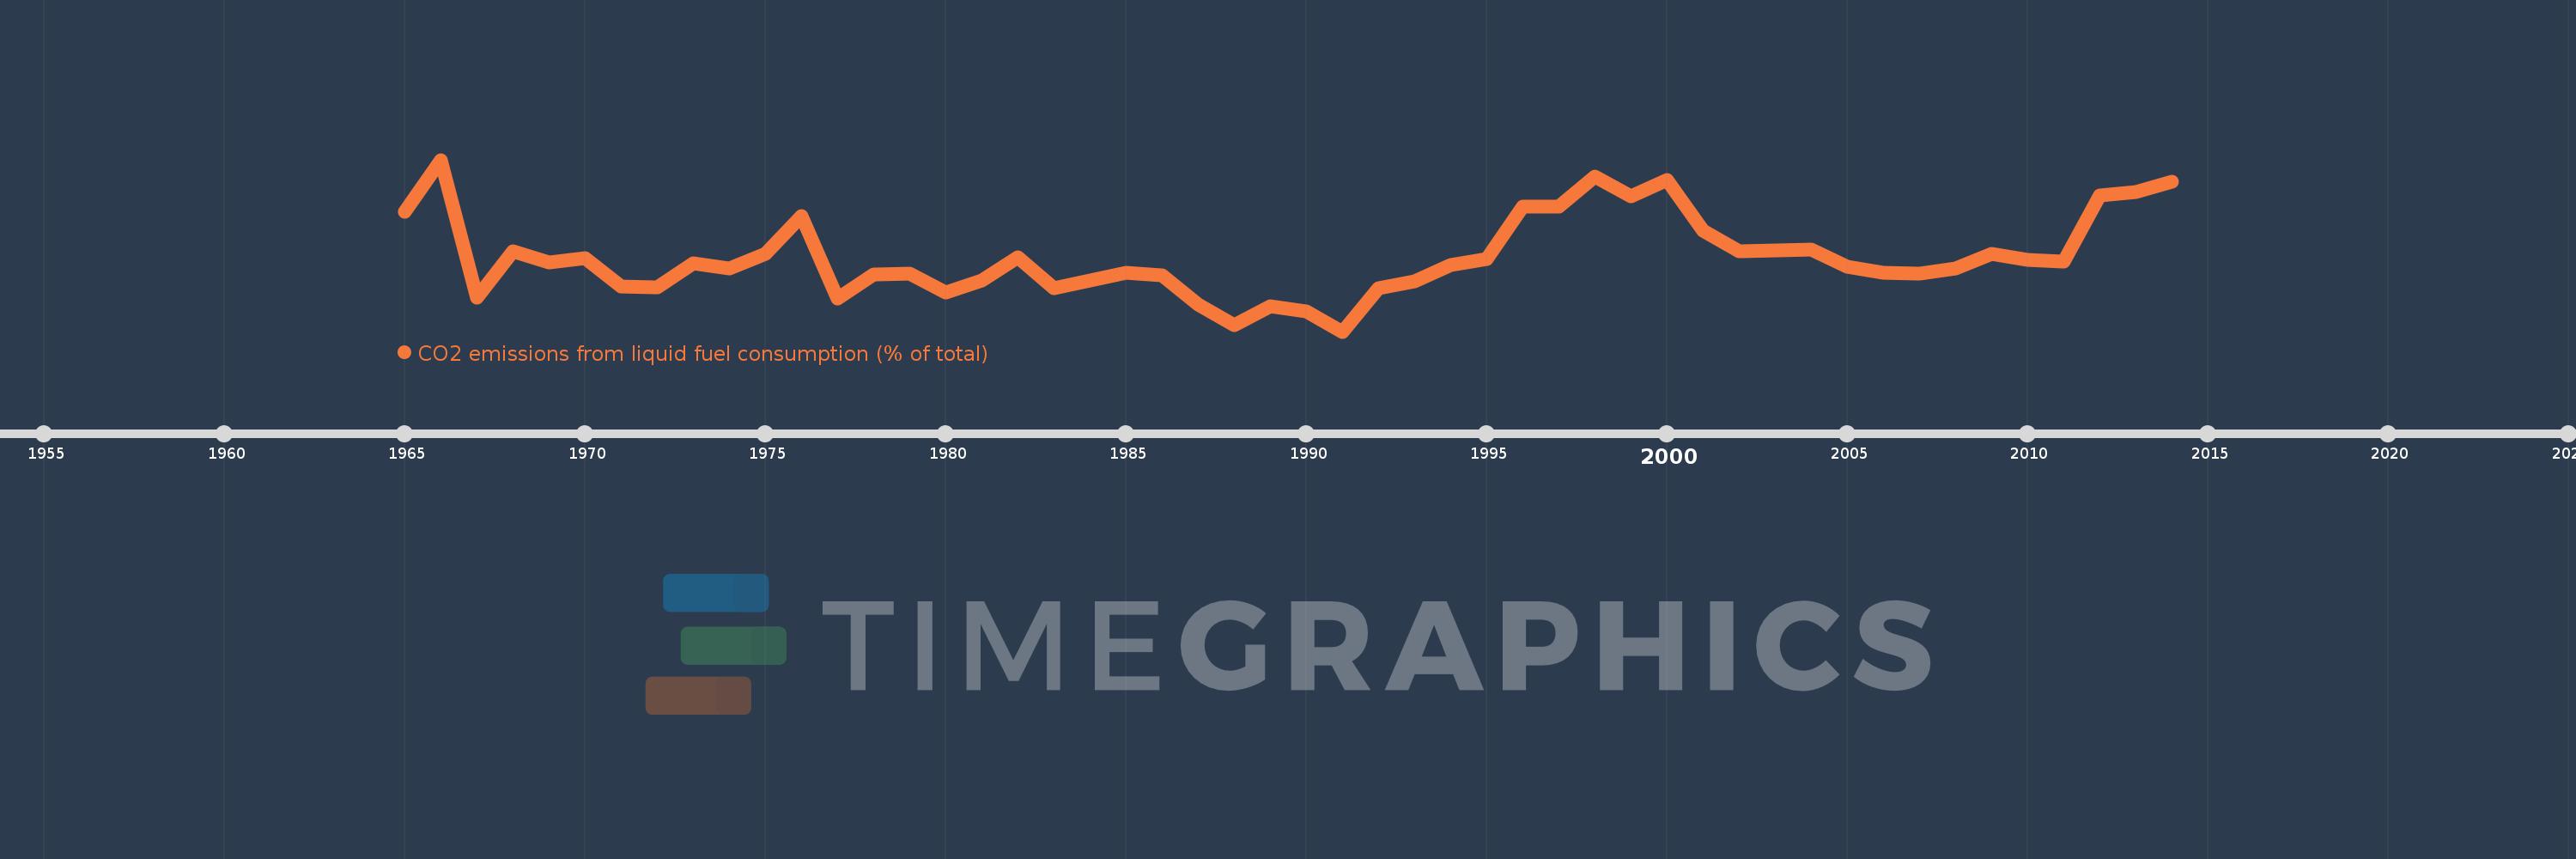
CO2 emissions from liquid fuel consumption (% of total)
2014,2013,2012,2011,2010,2009,2008,2007,2006,2005,2004,2003,2002,2001,2000,1999,1998,1997,1996,1995,1994,1993,1992,1991,1990,1989,1988,1987,1986,1985,1984,1983,1982,1981,1980,1979,1978,1977,1976,1975,1974,1973,1972,1971,1970,1969,1968,1967,1966,1965
This statistics in other country:
AfghanistanAlbaniaAlgeriaAndorraAngolaAntigua and BarbudaArab WorldArgentinaArmeniaArubaAustraliaAustriaAzerbaijanBahamas, TheBahrainBangladeshBarbadosBelarusBelgiumBelizeBeninBermudaBhutanBoliviaBosnia and HerzegovinaBotswanaBrazilBritish Virgin IslandsBrunei DarussalamBulgariaBurkina FasoBurundiCabo VerdeCambodiaCameroonCanadaCaribbean small statesCayman IslandsCentral African RepublicCentral Europe and the BalticsChadChileChinaColombiaComorosCongo, Dem. Rep.Congo, Rep.Costa RicaCote d'IvoireCroatiaCubaCuracaoCyprusCzech RepublicDenmarkDjiboutiDominicaDominican RepublicEarly-demographic dividendEast Asia & PacificEast Asia & Pacific (excluding high income)East Asia & Pacific (IDA & IBRD countries)EcuadorEgypt, Arab Rep.El SalvadorEquatorial GuineaEritreaEstoniaEthiopiaEuro areaEurope & Central AsiaEurope & Central Asia (excluding high income)Europe & Central Asia (IDA & IBRD countries)European UnionFaroe IslandsFijiFinlandFragile and conflict affected situationsFranceFrench PolynesiaGabonGambia, TheGeorgiaGermanyGhanaGibraltarGreeceGreenlandGrenadaGuatemalaGuineaGuinea-BissauGuyanaHaitiHeavily indebted poor countries (HIPC)High incomeHondurasHong Kong SAR, ChinaHungaryIBRD onlyIcelandIDA & IBRD totalIDA blendIDA onlyIDA totalIndiaIndonesiaIran, Islamic Rep.IraqIrelandIsraelItalyJamaicaJapanJordanKazakhstanKenyaKiribatiKorea, Dem. People’s Rep.Korea, Rep.KuwaitKyrgyz RepublicLao PDRLate-demographic dividendLatin America & Caribbean Latin America & Caribbean (excluding high income)Latin America & the Caribbean (IDA & IBRD countries)LatviaLeast developed countries: UN classificationLebanonLesothoLiberiaLibyaLiechtensteinLithuaniaLow & middle incomeLow incomeLower middle incomeLuxembourgMacao SAR, ChinaMacedonia, FYRMadagascarMalawiMalaysiaMaldivesMaliMaltaMarshall IslandsMauritaniaMauritiusMexicoMicronesia, Fed. Sts.Middle East & North AfricaMiddle East & North Africa (excluding high income)Middle East & North Africa (IDA & IBRD countries)Middle incomeMoldovaMongoliaMontenegroMoroccoMozambiqueMyanmarNamibiaNauruNepalNetherlandsNew CaledoniaNew ZealandNicaraguaNigerNigeriaNorth AmericaNorwayOECD membersOmanOther small statesPacific island small statesPakistanPalauPanamaPapua New GuineaParaguayPeruPhilippinesPolandPortugalPost-demographic dividendPre-demographic dividendQatarRomaniaRussian FederationRwandaSamoaSao Tome and PrincipeSaudi ArabiaSenegalSerbiaSeychellesSierra LeoneSingaporeSint Maarten (Dutch part)Slovak RepublicSloveniaSmall statesSolomon IslandsSomaliaSouth AfricaSouth AsiaSouth Asia (IDA & IBRD)South SudanSpainSri LankaSt. Kitts and NevisSt. LuciaSt. Vincent and the GrenadinesSub-Saharan Africa Sub-Saharan Africa (excluding high income)Sub-Saharan Africa (IDA & IBRD countries)SudanSurinameSwazilandSwedenSwitzerlandSyrian Arab RepublicTajikistanTanzaniaThailandTimor-LesteTogoTongaTrinidad and TobagoTunisiaTurkeyTurkmenistanTurks and Caicos IslandsUgandaUkraineUnited Arab EmiratesUnited KingdomUnited StatesUpper middle incomeUruguayUzbekistanVanuatuVenezuela, RBVietnamWest Bank and GazaWorldYemen, Rep.ZambiaZimbabwe Timeline:
This timeline shows a graph from 1965 to 2014 of Zimbabwe. No data until 1964. Number of actual observations by date: 50.
Source name:
World Development Indicators
Source organization:
Carbon Dioxide Information Analysis Center, Environmental Sciences Division, Oak Ridge National Laboratory, Tennessee, United States.
Categories, topics:
Climate Change, Environment
Last updated:
apr 23, 2017
Indicators value changes by year
Maximum:
32.349
jan 1, 1966
At the date of observation
Value
Absolute change
Change from previous value
jan 1, 1965
25.902
+25.902
0.0%
jan 1, 1966
32.349
+6.447
24.89%
jan 1, 1967
15.343
-17.006
-52.57%
jan 1, 1968
21.107
+5.765
37.57%
jan 1, 1969
19.644
-1.463
-6.93%
jan 1, 1970
20.206
+0.563
2.86%
jan 1, 1971
16.757
-3.45
-17.07%
jan 1, 1972
16.653
-0.104
-0.62%
jan 1, 1973
19.617
+2.964
17.8%
jan 1, 1974
18.886
-0.731
-3.73%
jan 1, 1975
20.729
+1.843
9.76%
jan 1, 1976
25.386
+4.657
22.47%
jan 1, 1977
15.216
-10.17
-40.06%
jan 1, 1978
18.178
+2.962
19.47%
jan 1, 1979
18.343
+0.165
0.91%
jan 1, 1980
15.949
-2.394
-13.05%
jan 1, 1981
17.466
+1.517
9.51%
jan 1, 1982
20.365
+2.9
16.6%
jan 1, 1983
16.479
-3.886
-19.08%
jan 1, 1984
17.49
+1.011
6.13%
jan 1, 1985
18.404
+0.913
5.22%
jan 1, 1986
18.114
-0.29
-1.58%
jan 1, 1987
14.441
-3.672
-20.27%
jan 1, 1988
11.959
-2.483
-17.19%
jan 1, 1989
14.302
+2.343
19.6%
jan 1, 1990
13.616
-0.686
-4.8%
jan 1, 1991
11.14
-2.476
-18.18%
jan 1, 1992
16.477
+5.337
47.91%
jan 1, 1993
17.336
+0.858
5.21%
jan 1, 1994
19.389
+2.053
11.85%
jan 1, 1995
20.096
+0.706
3.64%
jan 1, 1996
26.612
+6.516
32.43%
jan 1, 1997
26.608
-0.004
-0.01%
jan 1, 1998
30.237
+3.629
13.64%
jan 1, 1999
27.811
-2.426
-8.02%
jan 1, 2000
29.852
+2.041
7.34%
jan 1, 2001
23.65
-6.202
-20.77%
jan 1, 2002
21.048
-2.602
-11.0%
jan 1, 2003
21.177
+0.129
0.61%
jan 1, 2004
21.301
+0.124
0.59%
jan 1, 2005
19.134
-2.167
-10.17%
jan 1, 2006
18.454
-0.68
-3.55%
jan 1, 2007
18.252
-0.202
-1.1%
jan 1, 2008
18.954
+0.702
3.85%
jan 1, 2009
20.717
+1.763
9.3%
jan 1, 2010
20.018
-0.7
-3.38%
jan 1, 2011
19.786
-0.231
-1.16%
jan 1, 2012
27.972
+8.186
41.37%
jan 1, 2013
28.409
+0.437
1.56%
jan 1, 2014
29.643
+1.234
4.34%
Ranking of countries by current statistics by years


Comments: