29
/
en
AIzaSyAYiBZKx7MnpbEhh9jyipgxe19OcubqV5w
April 1, 2024
130201
Ethiopia
ETH
true
2
1
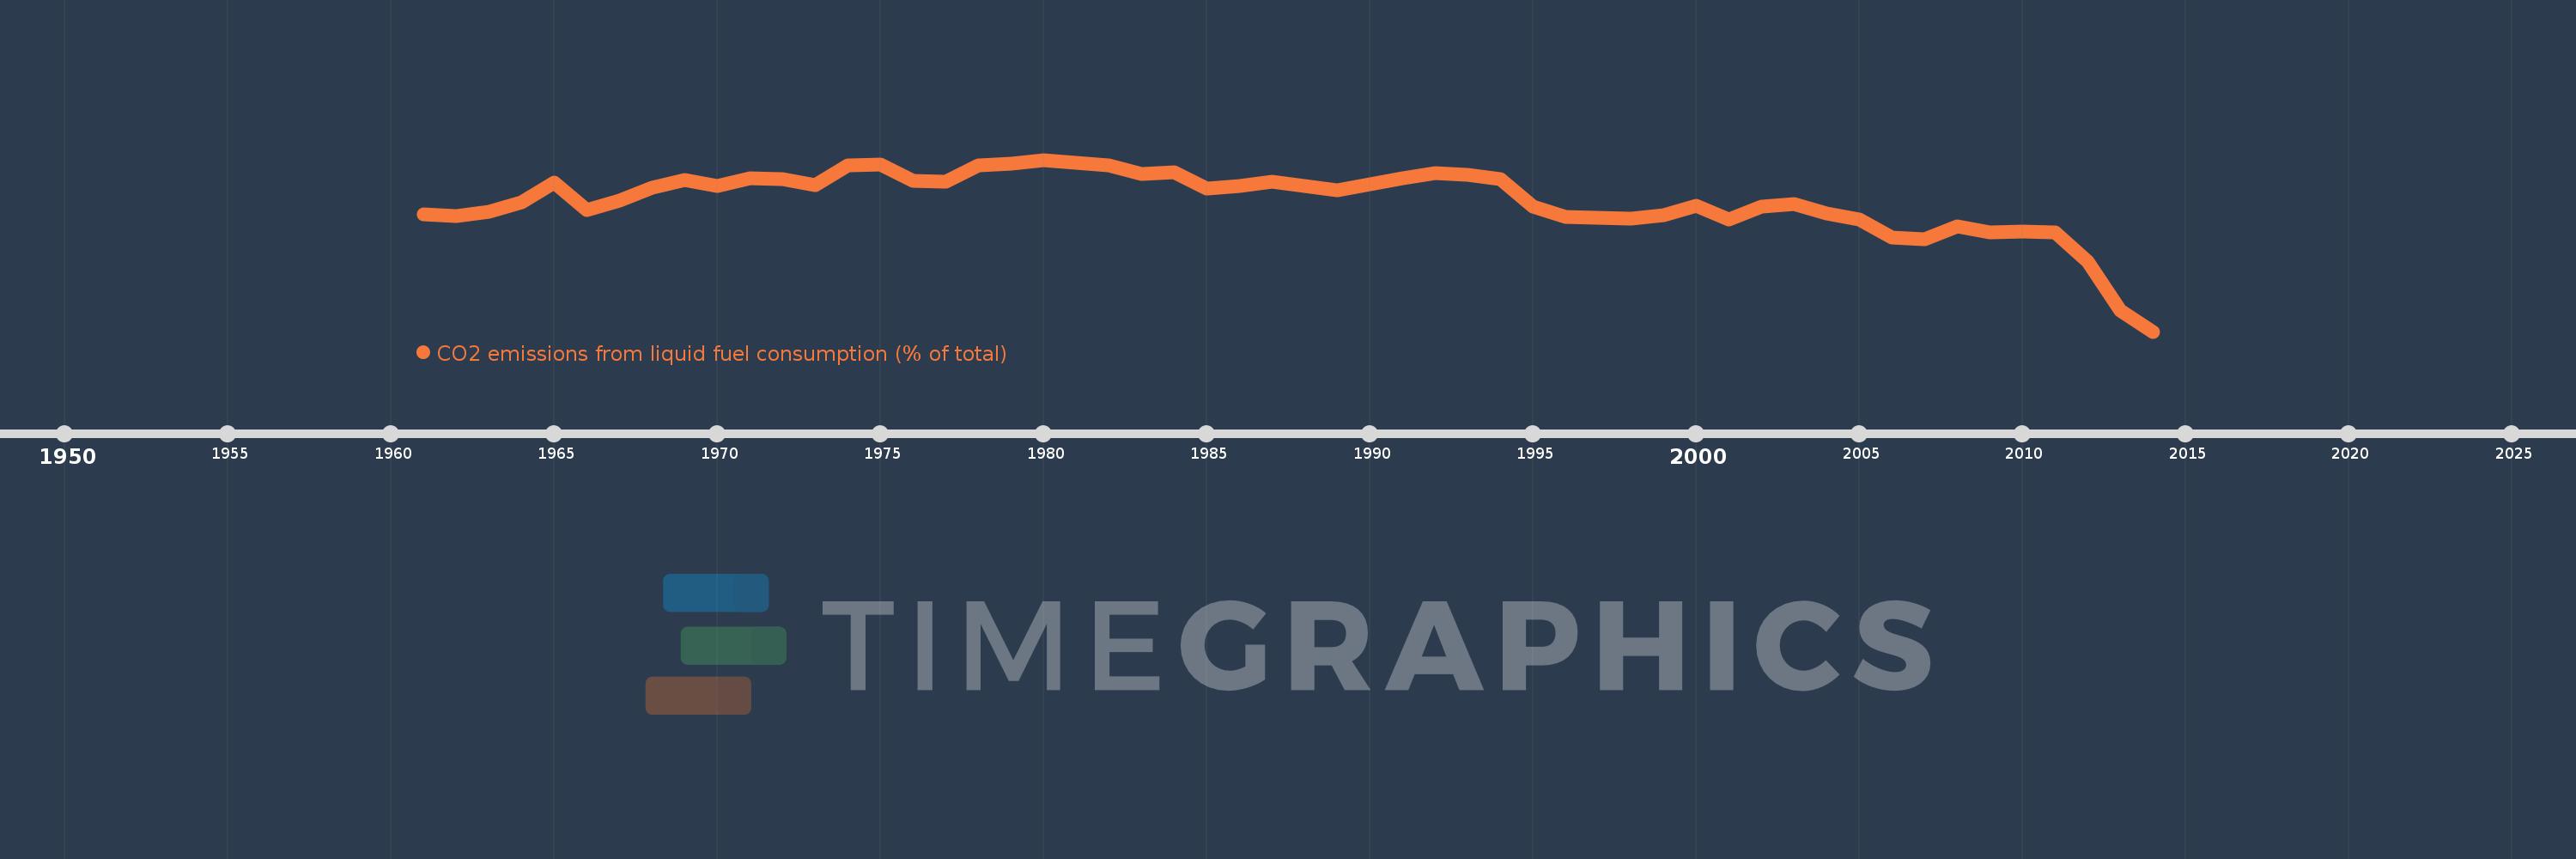
CO2 emissions from liquid fuel consumption (% of total)
2014,2013,2012,2011,2010,2009,2008,2007,2006,2005,2004,2003,2002,2001,2000,1999,1998,1997,1996,1995,1994,1993,1992,1991,1990,1989,1988,1987,1986,1985,1984,1983,1982,1981,1980,1979,1978,1977,1976,1975,1974,1973,1972,1971,1970,1969,1968,1967,1966,1965,1964,1963,1962,1961
This statistics in other country:
AfghanistanAlbaniaAlgeriaAndorraAngolaAntigua and BarbudaArab WorldArgentinaArmeniaArubaAustraliaAustriaAzerbaijanBahamas, TheBahrainBangladeshBarbadosBelarusBelgiumBelizeBeninBermudaBhutanBoliviaBosnia and HerzegovinaBotswanaBrazilBritish Virgin IslandsBrunei DarussalamBulgariaBurkina FasoBurundiCabo VerdeCambodiaCameroonCanadaCaribbean small statesCayman IslandsCentral African RepublicCentral Europe and the BalticsChadChileChinaColombiaComorosCongo, Dem. Rep.Congo, Rep.Costa RicaCote d'IvoireCroatiaCubaCuracaoCyprusCzech RepublicDenmarkDjiboutiDominicaDominican RepublicEarly-demographic dividendEast Asia & PacificEast Asia & Pacific (excluding high income)East Asia & Pacific (IDA & IBRD countries)EcuadorEgypt, Arab Rep.El SalvadorEquatorial GuineaEritreaEstoniaEthiopiaEuro areaEurope & Central AsiaEurope & Central Asia (excluding high income)Europe & Central Asia (IDA & IBRD countries)European UnionFaroe IslandsFijiFinlandFragile and conflict affected situationsFranceFrench PolynesiaGabonGambia, TheGeorgiaGermanyGhanaGibraltarGreeceGreenlandGrenadaGuatemalaGuineaGuinea-BissauGuyanaHaitiHeavily indebted poor countries (HIPC)High incomeHondurasHong Kong SAR, ChinaHungaryIBRD onlyIcelandIDA & IBRD totalIDA blendIDA onlyIDA totalIndiaIndonesiaIran, Islamic Rep.IraqIrelandIsraelItalyJamaicaJapanJordanKazakhstanKenyaKiribatiKorea, Dem. People’s Rep.Korea, Rep.KuwaitKyrgyz RepublicLao PDRLate-demographic dividendLatin America & Caribbean Latin America & Caribbean (excluding high income)Latin America & the Caribbean (IDA & IBRD countries)LatviaLeast developed countries: UN classificationLebanonLesothoLiberiaLibyaLiechtensteinLithuaniaLow & middle incomeLow incomeLower middle incomeLuxembourgMacao SAR, ChinaMacedonia, FYRMadagascarMalawiMalaysiaMaldivesMaliMaltaMarshall IslandsMauritaniaMauritiusMexicoMicronesia, Fed. Sts.Middle East & North AfricaMiddle East & North Africa (excluding high income)Middle East & North Africa (IDA & IBRD countries)Middle incomeMoldovaMongoliaMontenegroMoroccoMozambiqueMyanmarNamibiaNauruNepalNetherlandsNew CaledoniaNew ZealandNicaraguaNigerNigeriaNorth AmericaNorwayOECD membersOmanOther small statesPacific island small statesPakistanPalauPanamaPapua New GuineaParaguayPeruPhilippinesPolandPortugalPost-demographic dividendPre-demographic dividendQatarRomaniaRussian FederationRwandaSamoaSao Tome and PrincipeSaudi ArabiaSenegalSerbiaSeychellesSierra LeoneSingaporeSint Maarten (Dutch part)Slovak RepublicSloveniaSmall statesSolomon IslandsSomaliaSouth AfricaSouth AsiaSouth Asia (IDA & IBRD)South SudanSpainSri LankaSt. Kitts and NevisSt. LuciaSt. Vincent and the GrenadinesSub-Saharan Africa Sub-Saharan Africa (excluding high income)Sub-Saharan Africa (IDA & IBRD countries)SudanSurinameSwazilandSwedenSwitzerlandSyrian Arab RepublicTajikistanTanzaniaThailandTimor-LesteTogoTongaTrinidad and TobagoTunisiaTurkeyTurkmenistanTurks and Caicos IslandsUgandaUkraineUnited Arab EmiratesUnited KingdomUnited StatesUpper middle incomeUruguayUzbekistanVanuatuVenezuela, RBVietnamWest Bank and GazaWorldYemen, Rep.ZambiaZimbabwe Timeline:
This timeline shows a graph from 1961 to 2014 of Ethiopia. No data until 1960. Number of actual observations by date: 54.
Source name:
World Development Indicators
Source organization:
Carbon Dioxide Information Analysis Center, Environmental Sciences Division, Oak Ridge National Laboratory, Tennessee, United States.
Categories, topics:
Climate Change, Environment
Last updated:
apr 23, 2017
Indicators value changes by year
Minimum:
69.276
jan 1, 2014
Maximum:
97.421
jan 1, 1980
At the date of observation
Value
Absolute change
Change from previous value
jan 1, 1961
88.542
+88.542
0.0%
jan 1, 1962
88.172
-0.37
-0.42%
jan 1, 1963
88.889
+0.717
0.81%
jan 1, 1964
90.435
+1.546
1.74%
jan 1, 1965
93.694
+3.259
3.6%
jan 1, 1966
89.205
-4.489
-4.79%
jan 1, 1967
90.667
+1.462
1.64%
jan 1, 1968
92.833
+2.166
2.39%
jan 1, 1969
94.055
+1.222
1.32%
jan 1, 1970
93.187
-0.868
-0.92%
jan 1, 1971
94.457
+1.27
1.36%
jan 1, 1972
94.257
-0.199
-0.21%
jan 1, 1973
93.229
-1.028
-1.09%
jan 1, 1974
96.444
+3.214
3.45%
jan 1, 1975
96.624
+0.181
0.19%
jan 1, 1976
93.939
-2.685
-2.78%
jan 1, 1977
93.769
-0.17
-0.18%
jan 1, 1978
96.503
+2.734
2.92%
jan 1, 1979
96.791
+0.288
0.3%
jan 1, 1980
97.421
+0.629
0.65%
jan 1, 1981
96.982
-0.439
-0.45%
jan 1, 1982
96.464
-0.518
-0.53%
jan 1, 1983
95.05
-1.414
-1.47%
jan 1, 1984
95.427
+0.378
0.4%
jan 1, 1985
92.731
-2.696
-2.83%
jan 1, 1986
93.131
+0.4
0.43%
jan 1, 1987
93.874
+0.743
0.8%
jan 1, 1988
93.182
-0.692
-0.74%
jan 1, 1989
92.455
-0.726
-0.78%
jan 1, 1990
93.385
+0.93
1.01%
jan 1, 1991
94.411
+1.025
1.1%
jan 1, 1992
95.209
+0.798
0.85%
jan 1, 1993
94.932
-0.277
-0.29%
jan 1, 1994
94.189
-0.743
-0.78%
jan 1, 1995
89.689
-4.5
-4.78%
jan 1, 1996
88.126
-1.563
-1.74%
jan 1, 1997
87.949
-0.177
-0.2%
jan 1, 1998
87.74
-0.208
-0.24%
jan 1, 1999
88.383
+0.642
0.73%
jan 1, 2000
89.895
+1.513
1.71%
jan 1, 2001
87.603
-2.292
-2.55%
jan 1, 2002
89.722
+2.119
2.42%
jan 1, 2003
90.105
+0.383
0.43%
jan 1, 2004
88.676
-1.429
-1.59%
jan 1, 2005
87.604
-1.073
-1.21%
jan 1, 2006
84.742
-2.862
-3.27%
jan 1, 2007
84.344
-0.398
-0.47%
jan 1, 2008
86.524
+2.181
2.59%
jan 1, 2009
85.507
-1.017
-1.18%
jan 1, 2010
85.619
+0.112
0.13%
jan 1, 2011
85.579
-0.04
-0.05%
jan 1, 2012
80.731
-4.848
-5.67%
jan 1, 2013
72.677
-8.054
-9.98%
jan 1, 2014
69.276
-3.401
-4.68%
Ranking of countries by current statistics by years


Comments: