29
/
en
AIzaSyAYiBZKx7MnpbEhh9jyipgxe19OcubqV5w
April 1, 2024
69572
Argentina
ARG
true
2
1
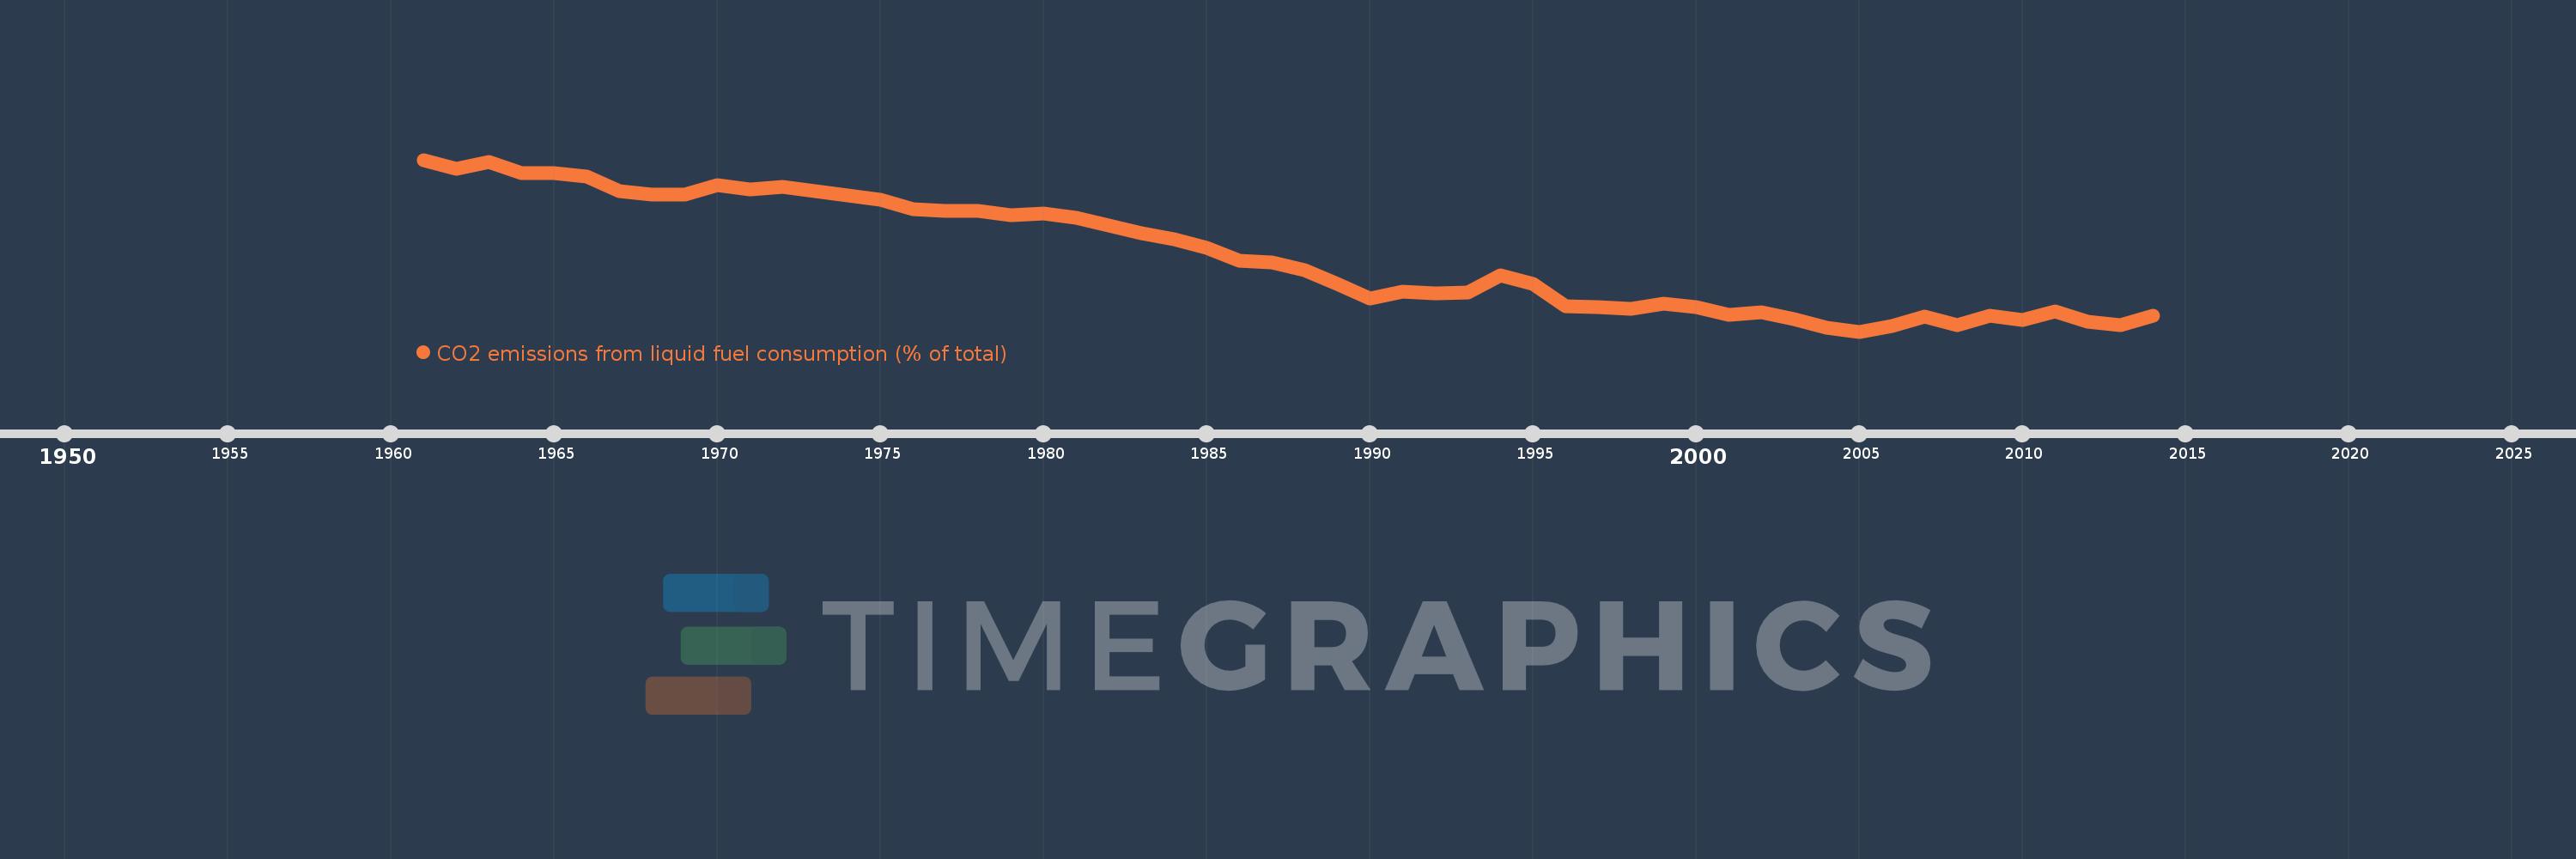
CO2 emissions from liquid fuel consumption (% of total)
2014,2013,2012,2011,2010,2009,2008,2007,2006,2005,2004,2003,2002,2001,2000,1999,1998,1997,1996,1995,1994,1993,1992,1991,1990,1989,1988,1987,1986,1985,1984,1983,1982,1981,1980,1979,1978,1977,1976,1975,1974,1973,1972,1971,1970,1969,1968,1967,1966,1965,1964,1963,1962,1961
This statistics in other country:
AfghanistanAlbaniaAlgeriaAndorraAngolaAntigua and BarbudaArab WorldArgentinaArmeniaArubaAustraliaAustriaAzerbaijanBahamas, TheBahrainBangladeshBarbadosBelarusBelgiumBelizeBeninBermudaBhutanBoliviaBosnia and HerzegovinaBotswanaBrazilBritish Virgin IslandsBrunei DarussalamBulgariaBurkina FasoBurundiCabo VerdeCambodiaCameroonCanadaCaribbean small statesCayman IslandsCentral African RepublicCentral Europe and the BalticsChadChileChinaColombiaComorosCongo, Dem. Rep.Congo, Rep.Costa RicaCote d'IvoireCroatiaCubaCuracaoCyprusCzech RepublicDenmarkDjiboutiDominicaDominican RepublicEarly-demographic dividendEast Asia & PacificEast Asia & Pacific (excluding high income)East Asia & Pacific (IDA & IBRD countries)EcuadorEgypt, Arab Rep.El SalvadorEquatorial GuineaEritreaEstoniaEthiopiaEuro areaEurope & Central AsiaEurope & Central Asia (excluding high income)Europe & Central Asia (IDA & IBRD countries)European UnionFaroe IslandsFijiFinlandFragile and conflict affected situationsFranceFrench PolynesiaGabonGambia, TheGeorgiaGermanyGhanaGibraltarGreeceGreenlandGrenadaGuatemalaGuineaGuinea-BissauGuyanaHaitiHeavily indebted poor countries (HIPC)High incomeHondurasHong Kong SAR, ChinaHungaryIBRD onlyIcelandIDA & IBRD totalIDA blendIDA onlyIDA totalIndiaIndonesiaIran, Islamic Rep.IraqIrelandIsraelItalyJamaicaJapanJordanKazakhstanKenyaKiribatiKorea, Dem. People’s Rep.Korea, Rep.KuwaitKyrgyz RepublicLao PDRLate-demographic dividendLatin America & Caribbean Latin America & Caribbean (excluding high income)Latin America & the Caribbean (IDA & IBRD countries)LatviaLeast developed countries: UN classificationLebanonLesothoLiberiaLibyaLiechtensteinLithuaniaLow & middle incomeLow incomeLower middle incomeLuxembourgMacao SAR, ChinaMacedonia, FYRMadagascarMalawiMalaysiaMaldivesMaliMaltaMarshall IslandsMauritaniaMauritiusMexicoMicronesia, Fed. Sts.Middle East & North AfricaMiddle East & North Africa (excluding high income)Middle East & North Africa (IDA & IBRD countries)Middle incomeMoldovaMongoliaMontenegroMoroccoMozambiqueMyanmarNamibiaNauruNepalNetherlandsNew CaledoniaNew ZealandNicaraguaNigerNigeriaNorth AmericaNorwayOECD membersOmanOther small statesPacific island small statesPakistanPalauPanamaPapua New GuineaParaguayPeruPhilippinesPolandPortugalPost-demographic dividendPre-demographic dividendQatarRomaniaRussian FederationRwandaSamoaSao Tome and PrincipeSaudi ArabiaSenegalSerbiaSeychellesSierra LeoneSingaporeSint Maarten (Dutch part)Slovak RepublicSloveniaSmall statesSolomon IslandsSomaliaSouth AfricaSouth AsiaSouth Asia (IDA & IBRD)South SudanSpainSri LankaSt. Kitts and NevisSt. LuciaSt. Vincent and the GrenadinesSub-Saharan Africa Sub-Saharan Africa (excluding high income)Sub-Saharan Africa (IDA & IBRD countries)SudanSurinameSwazilandSwedenSwitzerlandSyrian Arab RepublicTajikistanTanzaniaThailandTimor-LesteTogoTongaTrinidad and TobagoTunisiaTurkeyTurkmenistanTurks and Caicos IslandsUgandaUkraineUnited Arab EmiratesUnited KingdomUnited StatesUpper middle incomeUruguayUzbekistanVanuatuVenezuela, RBVietnamWest Bank and GazaWorldYemen, Rep.ZambiaZimbabwe Timeline:
This timeline shows a graph from 1961 to 2014 of Argentina. No data until 1960. Number of actual observations by date: 54.
Source name:
World Development Indicators
Source organization:
Carbon Dioxide Information Analysis Center, Environmental Sciences Division, Oak Ridge National Laboratory, Tennessee, United States.
Categories, topics:
Climate Change, Environment
Last updated:
apr 23, 2017
Indicators value changes by year
Minimum:
43.067
jan 1, 2005
At the date of observation
Value
Absolute change
Change from previous value
jan 1, 1961
84.45
+84.45
0.0%
jan 1, 1962
82.367
-2.083
-2.47%
jan 1, 1963
84.02
+1.652
2.01%
jan 1, 1964
81.22
-2.8
-3.33%
jan 1, 1965
81.194
-0.026
-0.03%
jan 1, 1966
80.458
-0.735
-0.91%
jan 1, 1967
76.989
-3.469
-4.31%
jan 1, 1968
75.999
-0.991
-1.29%
jan 1, 1969
76.145
+0.147
0.19%
jan 1, 1970
78.395
+2.25
2.95%
jan 1, 1971
77.329
-1.066
-1.36%
jan 1, 1972
78.004
+0.674
0.87%
jan 1, 1973
76.926
-1.078
-1.38%
jan 1, 1974
75.764
-1.162
-1.51%
jan 1, 1975
74.825
-0.939
-1.24%
jan 1, 1976
72.651
-2.174
-2.91%
jan 1, 1977
72.078
-0.573
-0.79%
jan 1, 1978
72.193
+0.115
0.16%
jan 1, 1979
71.083
-1.111
-1.54%
jan 1, 1980
71.486
+0.404
0.57%
jan 1, 1981
70.418
-1.068
-1.49%
jan 1, 1982
68.714
-1.704
-2.42%
jan 1, 1983
66.799
-1.915
-2.79%
jan 1, 1984
65.325
-1.474
-2.21%
jan 1, 1985
63.169
-2.156
-3.3%
jan 1, 1986
60.128
-3.041
-4.81%
jan 1, 1987
59.735
-0.394
-0.65%
jan 1, 1988
57.862
-1.872
-3.13%
jan 1, 1989
54.567
-3.295
-5.69%
jan 1, 1990
51.073
-3.495
-6.4%
jan 1, 1991
52.602
+1.529
2.99%
jan 1, 1992
52.369
-0.233
-0.44%
jan 1, 1993
52.438
+0.069
0.13%
jan 1, 1994
56.661
+4.223
8.05%
jan 1, 1995
54.528
-2.133
-3.77%
jan 1, 1996
49.143
-5.384
-9.87%
jan 1, 1997
48.871
-0.272
-0.55%
jan 1, 1998
48.493
-0.378
-0.77%
jan 1, 1999
49.803
+1.31
2.7%
jan 1, 2000
49.033
-0.77
-1.55%
jan 1, 2001
47.05
-1.983
-4.04%
jan 1, 2002
47.647
+0.597
1.27%
jan 1, 2003
46.139
-1.508
-3.16%
jan 1, 2004
43.983
-2.156
-4.67%
jan 1, 2005
43.067
-0.917
-2.08%
jan 1, 2006
44.327
+1.26
2.93%
jan 1, 2007
46.729
+2.402
5.42%
jan 1, 2008
44.535
-2.193
-4.69%
jan 1, 2009
46.921
+2.385
5.36%
jan 1, 2010
45.815
-1.106
-2.36%
jan 1, 2011
48.015
+2.201
4.8%
jan 1, 2012
45.395
-2.62
-5.46%
jan 1, 2013
44.537
-0.858
-1.89%
jan 1, 2014
46.801
+2.263
5.08%
Ranking of countries by current statistics by years


Comments: