29
/
en
AIzaSyAYiBZKx7MnpbEhh9jyipgxe19OcubqV5w
April 1, 2024
171510
Kuwait
KWT
true
2
1
CO2 emissions from liquid fuel consumption (% of total)
2014,2013,2012,2011,2010,2009,2008,2007,2006,2005,2004,2003,2002,2001,2000,1999,1998,1997,1996,1995,1994,1993,1992,1991,1990,1989,1988,1987,1986,1985,1984,1983,1982,1981,1980,1979,1978,1977,1976,1975,1974,1973,1972,1971,1970,1969,1968,1967,1966,1965,1964,1963,1962,1961
This statistics in other country:
AfghanistanAlbaniaAlgeriaAndorraAngolaAntigua and BarbudaArab WorldArgentinaArmeniaArubaAustraliaAustriaAzerbaijanBahamas, TheBahrainBangladeshBarbadosBelarusBelgiumBelizeBeninBermudaBhutanBoliviaBosnia and HerzegovinaBotswanaBrazilBritish Virgin IslandsBrunei DarussalamBulgariaBurkina FasoBurundiCabo VerdeCambodiaCameroonCanadaCaribbean small statesCayman IslandsCentral African RepublicCentral Europe and the BalticsChadChileChinaColombiaComorosCongo, Dem. Rep.Congo, Rep.Costa RicaCote d'IvoireCroatiaCubaCuracaoCyprusCzech RepublicDenmarkDjiboutiDominicaDominican RepublicEarly-demographic dividendEast Asia & PacificEast Asia & Pacific (excluding high income)East Asia & Pacific (IDA & IBRD countries)EcuadorEgypt, Arab Rep.El SalvadorEquatorial GuineaEritreaEstoniaEthiopiaEuro areaEurope & Central AsiaEurope & Central Asia (excluding high income)Europe & Central Asia (IDA & IBRD countries)European UnionFaroe IslandsFijiFinlandFragile and conflict affected situationsFranceFrench PolynesiaGabonGambia, TheGeorgiaGermanyGhanaGibraltarGreeceGreenlandGrenadaGuatemalaGuineaGuinea-BissauGuyanaHaitiHeavily indebted poor countries (HIPC)High incomeHondurasHong Kong SAR, ChinaHungaryIBRD onlyIcelandIDA & IBRD totalIDA blendIDA onlyIDA totalIndiaIndonesiaIran, Islamic Rep.IraqIrelandIsraelItalyJamaicaJapanJordanKazakhstanKenyaKiribatiKorea, Dem. People’s Rep.Korea, Rep.KuwaitKyrgyz RepublicLao PDRLate-demographic dividendLatin America & Caribbean Latin America & Caribbean (excluding high income)Latin America & the Caribbean (IDA & IBRD countries)LatviaLeast developed countries: UN classificationLebanonLesothoLiberiaLibyaLiechtensteinLithuaniaLow & middle incomeLow incomeLower middle incomeLuxembourgMacao SAR, ChinaMacedonia, FYRMadagascarMalawiMalaysiaMaldivesMaliMaltaMarshall IslandsMauritaniaMauritiusMexicoMicronesia, Fed. Sts.Middle East & North AfricaMiddle East & North Africa (excluding high income)Middle East & North Africa (IDA & IBRD countries)Middle incomeMoldovaMongoliaMontenegroMoroccoMozambiqueMyanmarNamibiaNauruNepalNetherlandsNew CaledoniaNew ZealandNicaraguaNigerNigeriaNorth AmericaNorwayOECD membersOmanOther small statesPacific island small statesPakistanPalauPanamaPapua New GuineaParaguayPeruPhilippinesPolandPortugalPost-demographic dividendPre-demographic dividendQatarRomaniaRussian FederationRwandaSamoaSao Tome and PrincipeSaudi ArabiaSenegalSerbiaSeychellesSierra LeoneSingaporeSint Maarten (Dutch part)Slovak RepublicSloveniaSmall statesSolomon IslandsSomaliaSouth AfricaSouth AsiaSouth Asia (IDA & IBRD)South SudanSpainSri LankaSt. Kitts and NevisSt. LuciaSt. Vincent and the GrenadinesSub-Saharan Africa Sub-Saharan Africa (excluding high income)Sub-Saharan Africa (IDA & IBRD countries)SudanSurinameSwazilandSwedenSwitzerlandSyrian Arab RepublicTajikistanTanzaniaThailandTimor-LesteTogoTongaTrinidad and TobagoTunisiaTurkeyTurkmenistanTurks and Caicos IslandsUgandaUkraineUnited Arab EmiratesUnited KingdomUnited StatesUpper middle incomeUruguayUzbekistanVanuatuVenezuela, RBVietnamWest Bank and GazaWorldYemen, Rep.ZambiaZimbabwe Timeline:
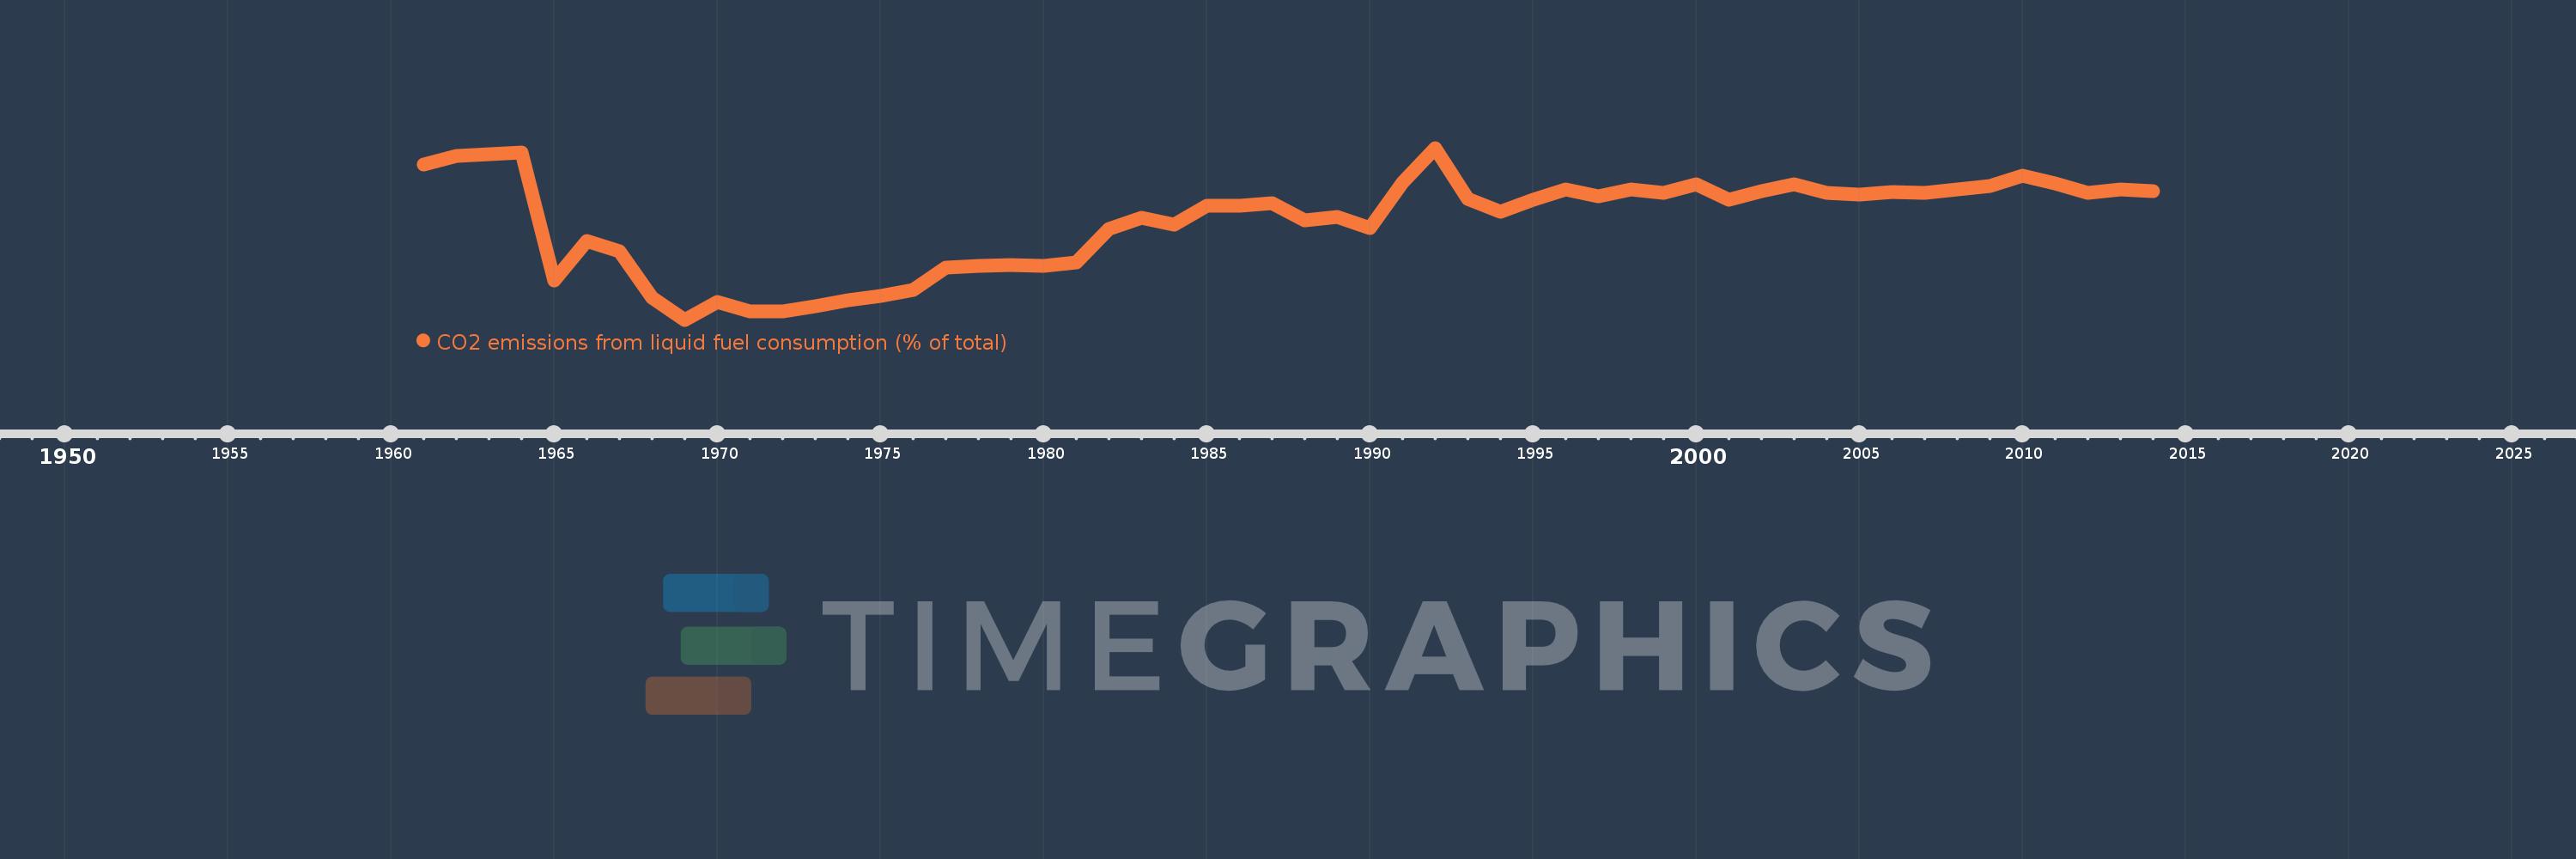
This timeline shows a graph from 1961 to 2014 of Kuwait. No data until 1960. Number of actual observations by date: 54.
Source name:
World Development Indicators
Source organization:
Carbon Dioxide Information Analysis Center, Environmental Sciences Division, Oak Ridge National Laboratory, Tennessee, United States.
Categories, topics:
Climate Change, Environment
Last updated:
apr 23, 2017
Indicators value changes by year
Minimum:
-3.235
jan 1, 1969
Maximum:
85.282
jan 1, 1992
At the date of observation
Value
Absolute change
Change from previous value
jan 1, 1961
76.833
+76.833
0.0%
jan 1, 1962
81.117
+4.284
5.58%
jan 1, 1963
82.166
+1.049
1.29%
jan 1, 1964
82.856
+0.69
0.84%
jan 1, 1965
17.152
-65.704
-79.3%
jan 1, 1966
37.188
+20.037
116.82%
jan 1, 1967
32.224
-4.964
-13.35%
jan 1, 1968
7.971
-24.253
-75.27%
jan 1, 1969
-3.235
-11.206
-140.59%
jan 1, 1970
5.836
+9.071
-280.38%
jan 1, 1971
1.113
-4.723
-80.93%
jan 1, 1972
1.27
+0.157
14.13%
jan 1, 1973
3.715
+2.445
192.54%
jan 1, 1974
6.822
+3.106
83.61%
jan 1, 1975
9.068
+2.247
32.93%
jan 1, 1976
12.181
+3.113
34.33%
jan 1, 1977
23.759
+11.578
95.05%
jan 1, 1978
24.553
+0.793
3.34%
jan 1, 1979
25.162
+0.609
2.48%
jan 1, 1980
24.575
-0.587
-2.33%
jan 1, 1981
26.364
+1.789
7.28%
jan 1, 1982
43.717
+17.354
65.83%
jan 1, 1983
49.108
+5.391
12.33%
jan 1, 1984
45.698
-3.41
-6.94%
jan 1, 1985
55.507
+9.808
21.46%
jan 1, 1986
55.697
+0.19
0.34%
jan 1, 1987
56.634
+0.937
1.68%
jan 1, 1988
48.171
-8.464
-14.94%
jan 1, 1989
49.933
+1.763
3.66%
jan 1, 1990
44.165
-5.768
-11.55%
jan 1, 1991
67.347
+23.182
52.49%
jan 1, 1992
85.282
+17.935
26.63%
jan 1, 1993
58.835
-26.448
-31.01%
jan 1, 1994
52.425
-6.41
-10.9%
jan 1, 1995
58.737
+6.313
12.04%
jan 1, 1996
63.96
+5.223
8.89%
jan 1, 1997
60.466
-3.493
-5.46%
jan 1, 1998
63.971
+3.505
5.8%
jan 1, 1999
62.065
-1.906
-2.98%
jan 1, 2000
66.556
+4.491
7.24%
jan 1, 2001
58.449
-8.107
-12.18%
jan 1, 2002
62.987
+4.539
7.77%
jan 1, 2003
66.686
+3.698
5.87%
jan 1, 2004
62.291
-4.394
-6.59%
jan 1, 2005
61.318
-0.973
-1.56%
jan 1, 2006
62.79
+1.472
2.4%
jan 1, 2007
62.246
-0.544
-0.87%
jan 1, 2008
63.927
+1.682
2.7%
jan 1, 2009
65.764
+1.836
2.87%
jan 1, 2010
70.787
+5.023
7.64%
jan 1, 2011
67.006
-3.781
-5.34%
jan 1, 2012
62.182
-4.825
-7.2%
jan 1, 2013
64.094
+1.912
3.07%
jan 1, 2014
63.124
-0.97
-1.51%
Ranking of countries by current statistics by years


Comments: