29
/
en
AIzaSyAYiBZKx7MnpbEhh9jyipgxe19OcubqV5w
April 1, 2024
31568
Europe & Central Asia (excluding high income)
ECA
false
2
1
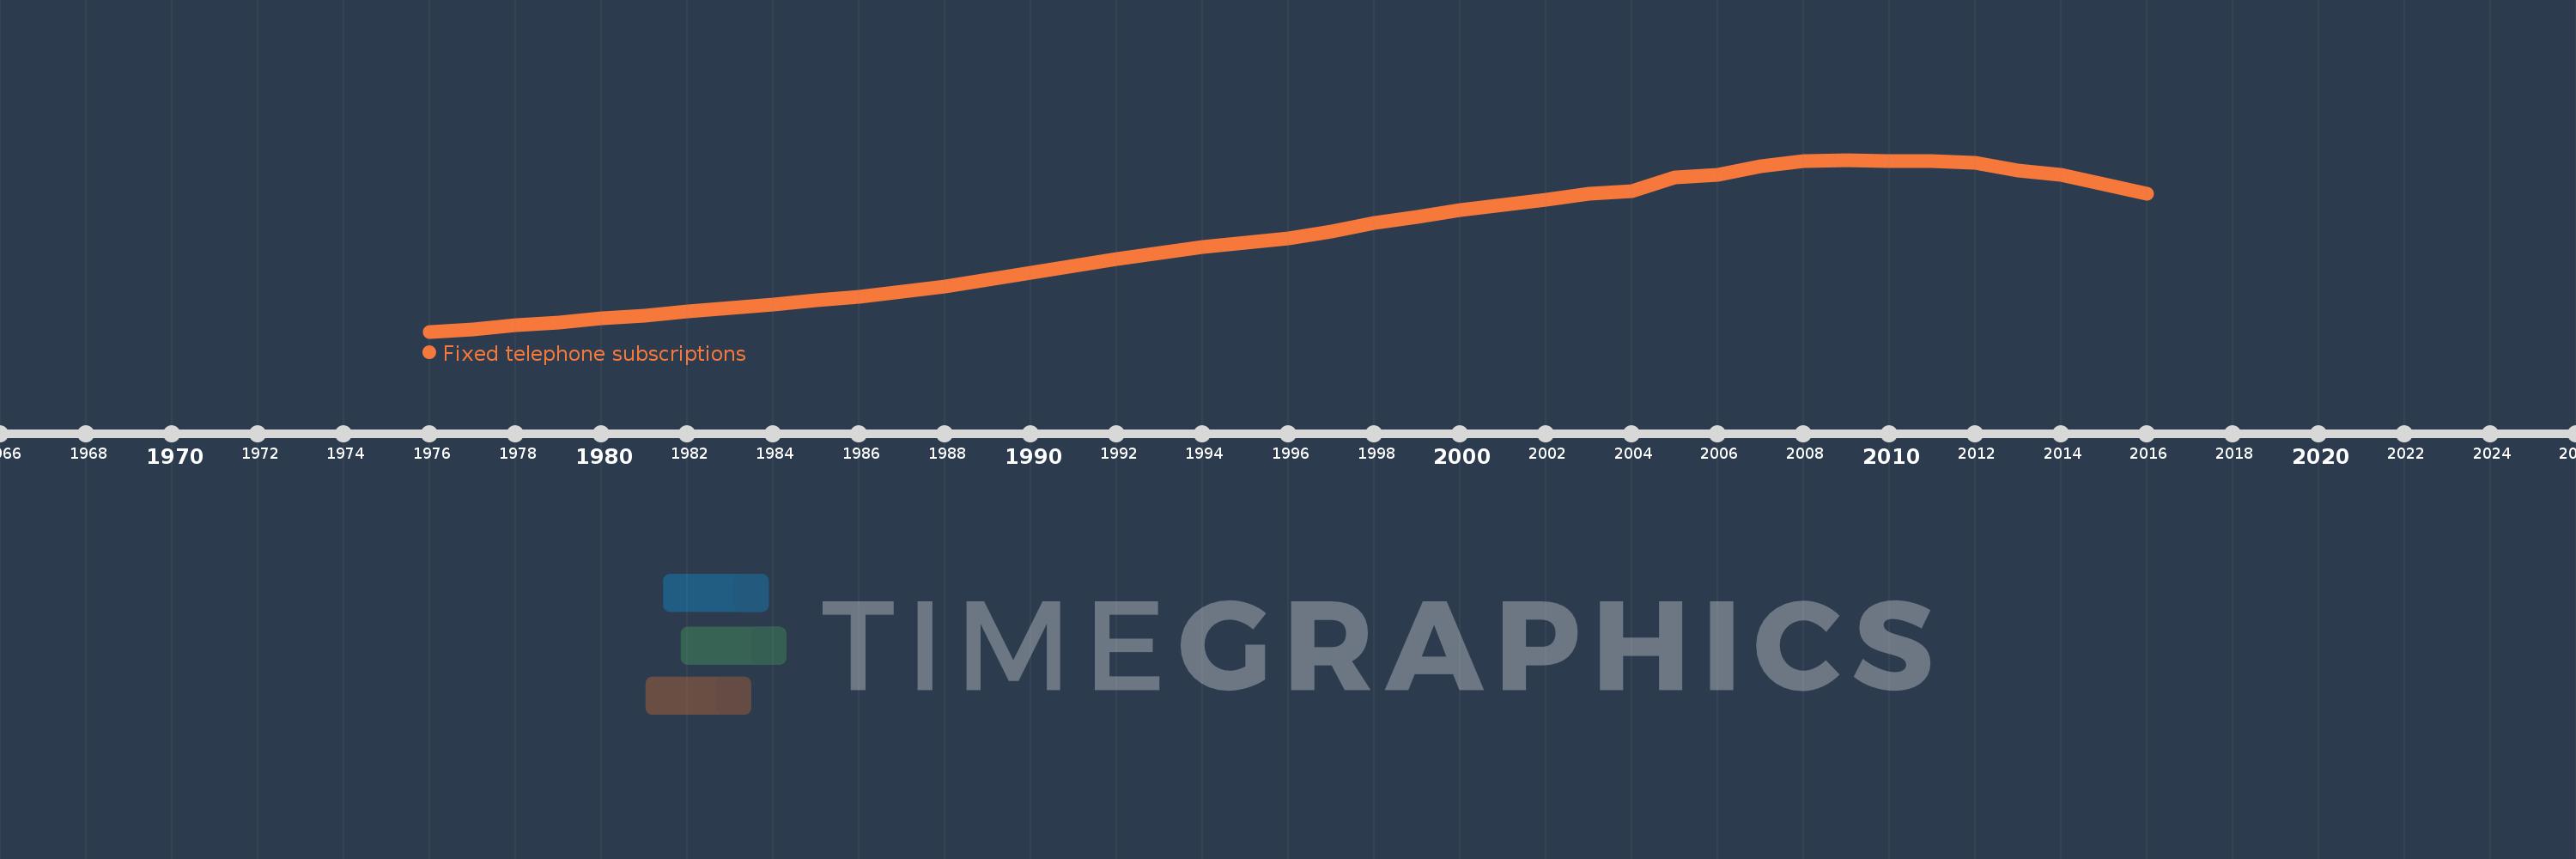
Fixed telephone subscriptions
2016,2015,2014,2013,2012,2011,2010,2009,2008,2007,2006,2005,2004,2003,2002,2001,2000,1999,1998,1997,1996,1995,1994,1993,1992,1991,1990,1989,1988,1987,1986,1985,1984,1983,1982,1981,1980,1979,1978,1977,1976
This statistics in other country:
AfghanistanAlbaniaAlgeriaAmerican SamoaAndorraAngolaAntigua and BarbudaArab WorldArgentinaArmeniaArubaAustraliaAustriaAzerbaijanBahamas, TheBahrainBangladeshBarbadosBelarusBelgiumBelizeBeninBermudaBhutanBoliviaBosnia and HerzegovinaBotswanaBrazilBritish Virgin IslandsBrunei DarussalamBulgariaBurkina FasoBurundiCabo VerdeCambodiaCameroonCanadaCaribbean small statesCayman IslandsCentral African RepublicCentral Europe and the BalticsChadChileChinaColombiaComorosCongo, Dem. Rep.Congo, Rep.Costa RicaCote d'IvoireCroatiaCubaCuracaoCyprusCzech RepublicDenmarkDjiboutiDominicaDominican RepublicEarly-demographic dividendEast Asia & PacificEast Asia & Pacific (excluding high income)East Asia & Pacific (IDA & IBRD countries)EcuadorEgypt, Arab Rep.El SalvadorEquatorial GuineaEritreaEstoniaEthiopiaEuro areaEurope & Central AsiaEurope & Central Asia (excluding high income)Europe & Central Asia (IDA & IBRD countries)European UnionFaroe IslandsFijiFinlandFragile and conflict affected situationsFranceFrench PolynesiaGabonGambia, TheGeorgiaGermanyGhanaGibraltarGreeceGreenlandGrenadaGuamGuatemalaGuineaGuinea-BissauGuyanaHaitiHeavily indebted poor countries (HIPC)High incomeHondurasHong Kong SAR, ChinaHungaryIBRD onlyIcelandIDA & IBRD totalIDA blendIDA onlyIDA totalIndiaIndonesiaIran, Islamic Rep.IraqIrelandIsraelItalyJamaicaJapanJordanKazakhstanKenyaKiribatiKorea, Dem. People’s Rep.Korea, Rep.KosovoKuwaitKyrgyz RepublicLao PDRLate-demographic dividendLatin America & Caribbean Latin America & Caribbean (excluding high income)Latin America & the Caribbean (IDA & IBRD countries)LatviaLeast developed countries: UN classificationLebanonLesothoLiberiaLibyaLiechtensteinLithuaniaLow & middle incomeLow incomeLower middle incomeLuxembourgMacao SAR, ChinaMacedonia, FYRMadagascarMalawiMalaysiaMaldivesMaliMaltaMarshall IslandsMauritaniaMauritiusMexicoMicronesia, Fed. Sts.Middle East & North AfricaMiddle East & North Africa (excluding high income)Middle East & North Africa (IDA & IBRD countries)Middle incomeMoldovaMonacoMongoliaMontenegroMoroccoMozambiqueMyanmarNamibiaNauruNepalNetherlandsNew CaledoniaNew ZealandNicaraguaNigerNigeriaNorth AmericaNorthern Mariana IslandsNorwayOECD membersOmanOther small statesPacific island small statesPakistanPalauPanamaPapua New GuineaParaguayPeruPhilippinesPolandPortugalPost-demographic dividendPre-demographic dividendPuerto RicoQatarRomaniaRussian FederationRwandaSamoaSan MarinoSao Tome and PrincipeSaudi ArabiaSenegalSerbiaSeychellesSierra LeoneSingaporeSlovak RepublicSloveniaSmall statesSolomon IslandsSomaliaSouth AfricaSouth AsiaSouth Asia (IDA & IBRD)South SudanSpainSri LankaSt. Kitts and NevisSt. LuciaSt. Vincent and the GrenadinesSub-Saharan Africa Sub-Saharan Africa (excluding high income)Sub-Saharan Africa (IDA & IBRD countries)SudanSurinameSwazilandSwedenSwitzerlandSyrian Arab RepublicTajikistanTanzaniaThailandTimor-LesteTogoTongaTrinidad and TobagoTunisiaTurkeyTurkmenistanTurks and Caicos IslandsTuvaluUgandaUkraineUnited Arab EmiratesUnited KingdomUnited StatesUpper middle incomeUruguayUzbekistanVanuatuVenezuela, RBVietnamVirgin Islands (U.S.)West Bank and GazaWorldYemen, Rep.ZambiaZimbabwe Timeline:
This timeline shows a graph from 1976 to 2016 of Europe & Central Asia (excluding high income). No data until 1975. Number of actual observations by date: 41.
Source name:
World Development Indicators
Source organization:
International Telecommunication Union, World Telecommunication/ICT Development Report and database, and World Bank estimates.
Categories, topics:
Infrastructure
Last updated:
apr 23, 2017
Indicators value changes by year
Minimum:
12.533 mln
jan 1, 1976
Maximum:
102.31 mln
jan 1, 2009
At the date of observation
Value
Absolute change
Change from previous value
jan 1, 1976
12.533 mln
+12.533 mln
0.0%
jan 1, 1977
13.816 mln
+1.283 mln
10.24%
jan 1, 1978
15.739 mln
+1.923 mln
13.92%
jan 1, 1979
17.16 mln
+1.421 mln
9.03%
jan 1, 1980
19.503 mln
+2.342 mln
13.65%
jan 1, 1981
20.726 mln
+1.224 mln
6.28%
jan 1, 1982
23.048 mln
+2.322 mln
11.2%
jan 1, 1983
24.655 mln
+1.607 mln
6.97%
jan 1, 1984
26.759 mln
+2.104 mln
8.53%
jan 1, 1985
28.737 mln
+1.978 mln
7.39%
jan 1, 1986
30.79 mln
+2.053 mln
7.14%
jan 1, 1987
33.291 mln
+2.501 mln
8.12%
jan 1, 1988
36.302 mln
+3.01 mln
9.04%
jan 1, 1989
39.87 mln
+3.569 mln
9.83%
jan 1, 1990
43.311 mln
+3.44 mln
8.63%
jan 1, 1991
46.723 mln
+3.413 mln
7.88%
jan 1, 1992
50.403 mln
+3.68 mln
7.88%
jan 1, 1993
53.609 mln
+3.205 mln
6.36%
jan 1, 1994
56.742 mln
+3.133 mln
5.85%
jan 1, 1995
58.937 mln
+2.195 mln
3.87%
jan 1, 1996
61.377 mln
+2.441 mln
4.14%
jan 1, 1997
64.856 mln
+3.479 mln
5.67%
jan 1, 1998
69.175 mln
+4.319 mln
6.66%
jan 1, 1999
72.265 mln
+3.09 mln
4.47%
jan 1, 2000
75.928 mln
+3.663 mln
5.07%
jan 1, 2001
78.73 mln
+2.802 mln
3.69%
jan 1, 2002
81.51 mln
+2.78 mln
3.53%
jan 1, 2003
84.558 mln
+3.048 mln
3.74%
jan 1, 2004
85.991 mln
+1.433 mln
1.69%
jan 1, 2005
93.024 mln
+7.033 mln
8.18%
jan 1, 2006
94.297 mln
+1.273 mln
1.37%
jan 1, 2007
98.829 mln
+4.532 mln
4.81%
jan 1, 2008
101.623 mln
+2.794 mln
2.83%
jan 1, 2009
102.31 mln
+687.019K
0.68%
jan 1, 2010
101.854 mln
-456.06K
-0.45%
jan 1, 2011
101.692 mln
-162.361K
-0.16%
jan 1, 2012
100.536 mln
-1.156 mln
-1.14%
jan 1, 2013
96.741 mln
-3.795 mln
-3.77%
jan 1, 2014
94.35 mln
-2.391 mln
-2.47%
jan 1, 2015
89.635 mln
-4.715 mln
-5.0%
jan 1, 2016
84.556 mln
-5.079 mln
-5.67%
Ranking of countries by current statistics by years


Comments: