29
/
en
AIzaSyAYiBZKx7MnpbEhh9jyipgxe19OcubqV5w
April 1, 2024
284622
Yemen, Rep.
YEM
true
2
1
Fixed telephone subscriptions
2016,2015,2014,2013,2012,2011,2010,2009,2008,2007,2006,2005,2004,2003,2002,2001,2000,1999,1998,1997,1996,1995,1994,1993,1992,1991,1990,1989,1988,1987,1986,1985,1984,1983,1982,1981
This statistics in other country:
AfghanistanAlbaniaAlgeriaAmerican SamoaAndorraAngolaAntigua and BarbudaArab WorldArgentinaArmeniaArubaAustraliaAustriaAzerbaijanBahamas, TheBahrainBangladeshBarbadosBelarusBelgiumBelizeBeninBermudaBhutanBoliviaBosnia and HerzegovinaBotswanaBrazilBritish Virgin IslandsBrunei DarussalamBulgariaBurkina FasoBurundiCabo VerdeCambodiaCameroonCanadaCaribbean small statesCayman IslandsCentral African RepublicCentral Europe and the BalticsChadChileChinaColombiaComorosCongo, Dem. Rep.Congo, Rep.Costa RicaCote d'IvoireCroatiaCubaCuracaoCyprusCzech RepublicDenmarkDjiboutiDominicaDominican RepublicEarly-demographic dividendEast Asia & PacificEast Asia & Pacific (excluding high income)East Asia & Pacific (IDA & IBRD countries)EcuadorEgypt, Arab Rep.El SalvadorEquatorial GuineaEritreaEstoniaEthiopiaEuro areaEurope & Central AsiaEurope & Central Asia (excluding high income)Europe & Central Asia (IDA & IBRD countries)European UnionFaroe IslandsFijiFinlandFragile and conflict affected situationsFranceFrench PolynesiaGabonGambia, TheGeorgiaGermanyGhanaGibraltarGreeceGreenlandGrenadaGuamGuatemalaGuineaGuinea-BissauGuyanaHaitiHeavily indebted poor countries (HIPC)High incomeHondurasHong Kong SAR, ChinaHungaryIBRD onlyIcelandIDA & IBRD totalIDA blendIDA onlyIDA totalIndiaIndonesiaIran, Islamic Rep.IraqIrelandIsraelItalyJamaicaJapanJordanKazakhstanKenyaKiribatiKorea, Dem. People’s Rep.Korea, Rep.KosovoKuwaitKyrgyz RepublicLao PDRLate-demographic dividendLatin America & Caribbean Latin America & Caribbean (excluding high income)Latin America & the Caribbean (IDA & IBRD countries)LatviaLeast developed countries: UN classificationLebanonLesothoLiberiaLibyaLiechtensteinLithuaniaLow & middle incomeLow incomeLower middle incomeLuxembourgMacao SAR, ChinaMacedonia, FYRMadagascarMalawiMalaysiaMaldivesMaliMaltaMarshall IslandsMauritaniaMauritiusMexicoMicronesia, Fed. Sts.Middle East & North AfricaMiddle East & North Africa (excluding high income)Middle East & North Africa (IDA & IBRD countries)Middle incomeMoldovaMonacoMongoliaMontenegroMoroccoMozambiqueMyanmarNamibiaNauruNepalNetherlandsNew CaledoniaNew ZealandNicaraguaNigerNigeriaNorth AmericaNorthern Mariana IslandsNorwayOECD membersOmanOther small statesPacific island small statesPakistanPalauPanamaPapua New GuineaParaguayPeruPhilippinesPolandPortugalPost-demographic dividendPre-demographic dividendPuerto RicoQatarRomaniaRussian FederationRwandaSamoaSan MarinoSao Tome and PrincipeSaudi ArabiaSenegalSerbiaSeychellesSierra LeoneSingaporeSlovak RepublicSloveniaSmall statesSolomon IslandsSomaliaSouth AfricaSouth AsiaSouth Asia (IDA & IBRD)South SudanSpainSri LankaSt. Kitts and NevisSt. LuciaSt. Vincent and the GrenadinesSub-Saharan Africa Sub-Saharan Africa (excluding high income)Sub-Saharan Africa (IDA & IBRD countries)SudanSurinameSwazilandSwedenSwitzerlandSyrian Arab RepublicTajikistanTanzaniaThailandTimor-LesteTogoTongaTrinidad and TobagoTunisiaTurkeyTurkmenistanTurks and Caicos IslandsTuvaluUgandaUkraineUnited Arab EmiratesUnited KingdomUnited StatesUpper middle incomeUruguayUzbekistanVanuatuVenezuela, RBVietnamVirgin Islands (U.S.)West Bank and GazaWorldYemen, Rep.ZambiaZimbabwe Timeline:
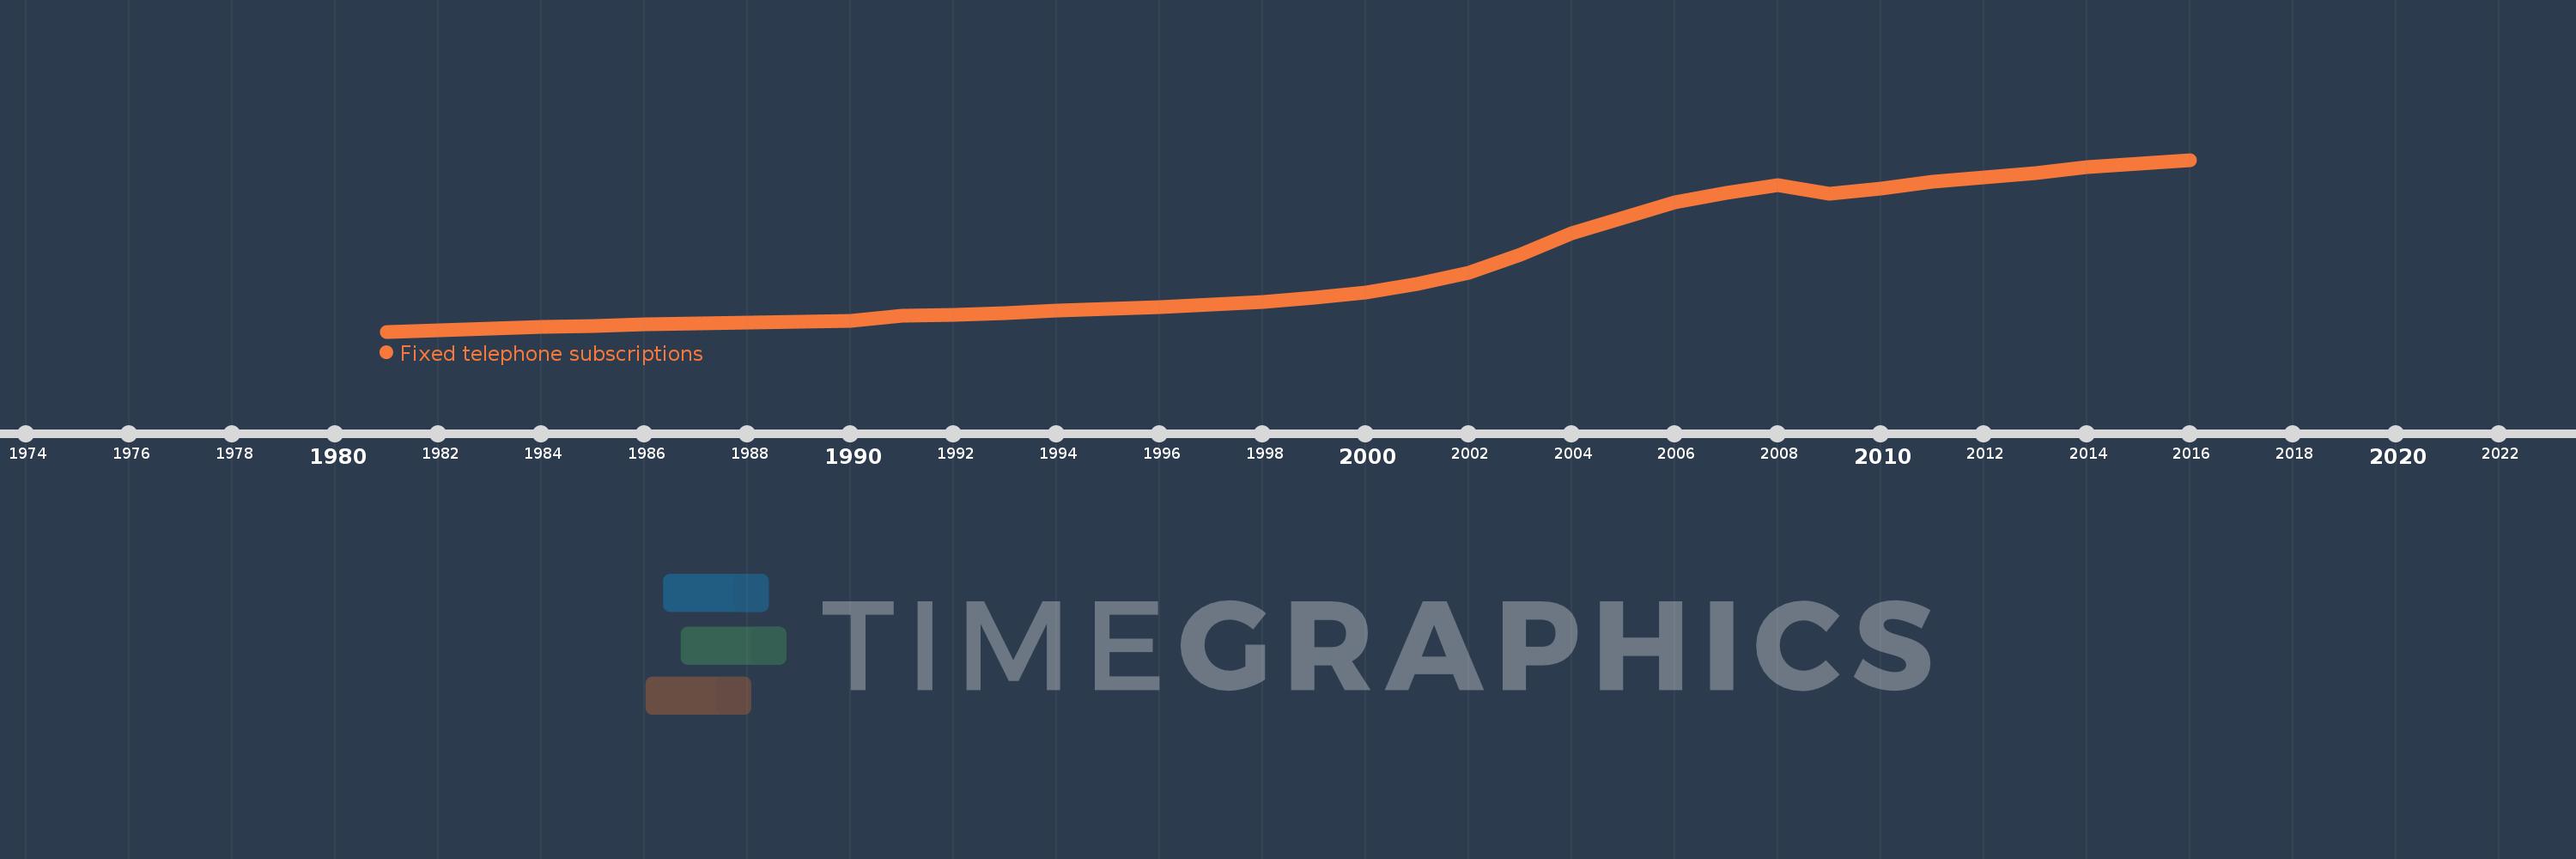
This timeline shows a graph from 1981 to 2016 of Yemen, Rep.. No data until 1980. Number of actual observations by date: 36.
Source name:
World Development Indicators
Source organization:
International Telecommunication Union, World Telecommunication/ICT Development Report and database, and World Bank estimates.
Categories, topics:
Infrastructure
Last updated:
apr 23, 2017
Indicators value changes by year
Minimum:
16.96K
jan 1, 1981
Maximum:
1.195 mln
jan 1, 2016
At the date of observation
Value
Absolute change
Change from previous value
jan 1, 1981
16.96K
+16.96K
0.0%
jan 1, 1982
24.171K
+7.211K
42.52%
jan 1, 1983
38.809K
+14.638K
60.56%
jan 1, 1984
49.879K
+11.07K
28.52%
jan 1, 1985
57.989K
+8.11K
16.26%
jan 1, 1986
67.486K
+9.497K
16.38%
jan 1, 1987
74.432K
+6.946K
10.29%
jan 1, 1988
81.172K
+6.74K
9.06%
jan 1, 1989
87.3K
+6.128K
7.55%
jan 1, 1990
92.8K
+5.5K
6.3%
jan 1, 1991
124.516K
+31.716K
34.18%
jan 1, 1992
130.943K
+6.427K
5.16%
jan 1, 1993
143.382K
+12.439K
9.5%
jan 1, 1994
161.112K
+17.73K
12.37%
jan 1, 1995
172.933K
+11.821K
7.34%
jan 1, 1996
186.659K
+13.726K
7.94%
jan 1, 1997
204.702K
+18.043K
9.67%
jan 1, 1998
220.275K
+15.573K
7.61%
jan 1, 1999
249.515K
+29.24K
13.27%
jan 1, 2000
284.296K
+34.781K
13.94%
jan 1, 2001
346.709K
+62.413K
21.95%
jan 1, 2002
422.228K
+75.519K
21.78%
jan 1, 2003
542.204K
+119.976K
28.41%
jan 1, 2004
693.884K
+151.68K
27.97%
jan 1, 2005
798.0K
+104.116K
15.0%
jan 1, 2006
901.385K
+103.385K
12.96%
jan 1, 2007
968.328K
+66.943K
7.43%
jan 1, 2008
1.022 mln
+53.672K
5.54%
jan 1, 2009
961.0K
-61.0K
-5.97%
jan 1, 2010
997.0K
+36.0K
3.75%
jan 1, 2011
1.046 mln
+49.263K
4.94%
jan 1, 2012
1.075 mln
+28.737K
2.75%
jan 1, 2013
1.104 mln
+29.0K
2.7%
jan 1, 2014
1.143 mln
+39.0K
3.53%
jan 1, 2015
1.169 mln
+25.6K
2.24%
jan 1, 2016
1.195 mln
+26.4K
2.26%
Ranking of countries by current statistics by years


Comments: