29
/
en
AIzaSyAYiBZKx7MnpbEhh9jyipgxe19OcubqV5w
April 1, 2024
137996
Georgia
GEO
true
2
1
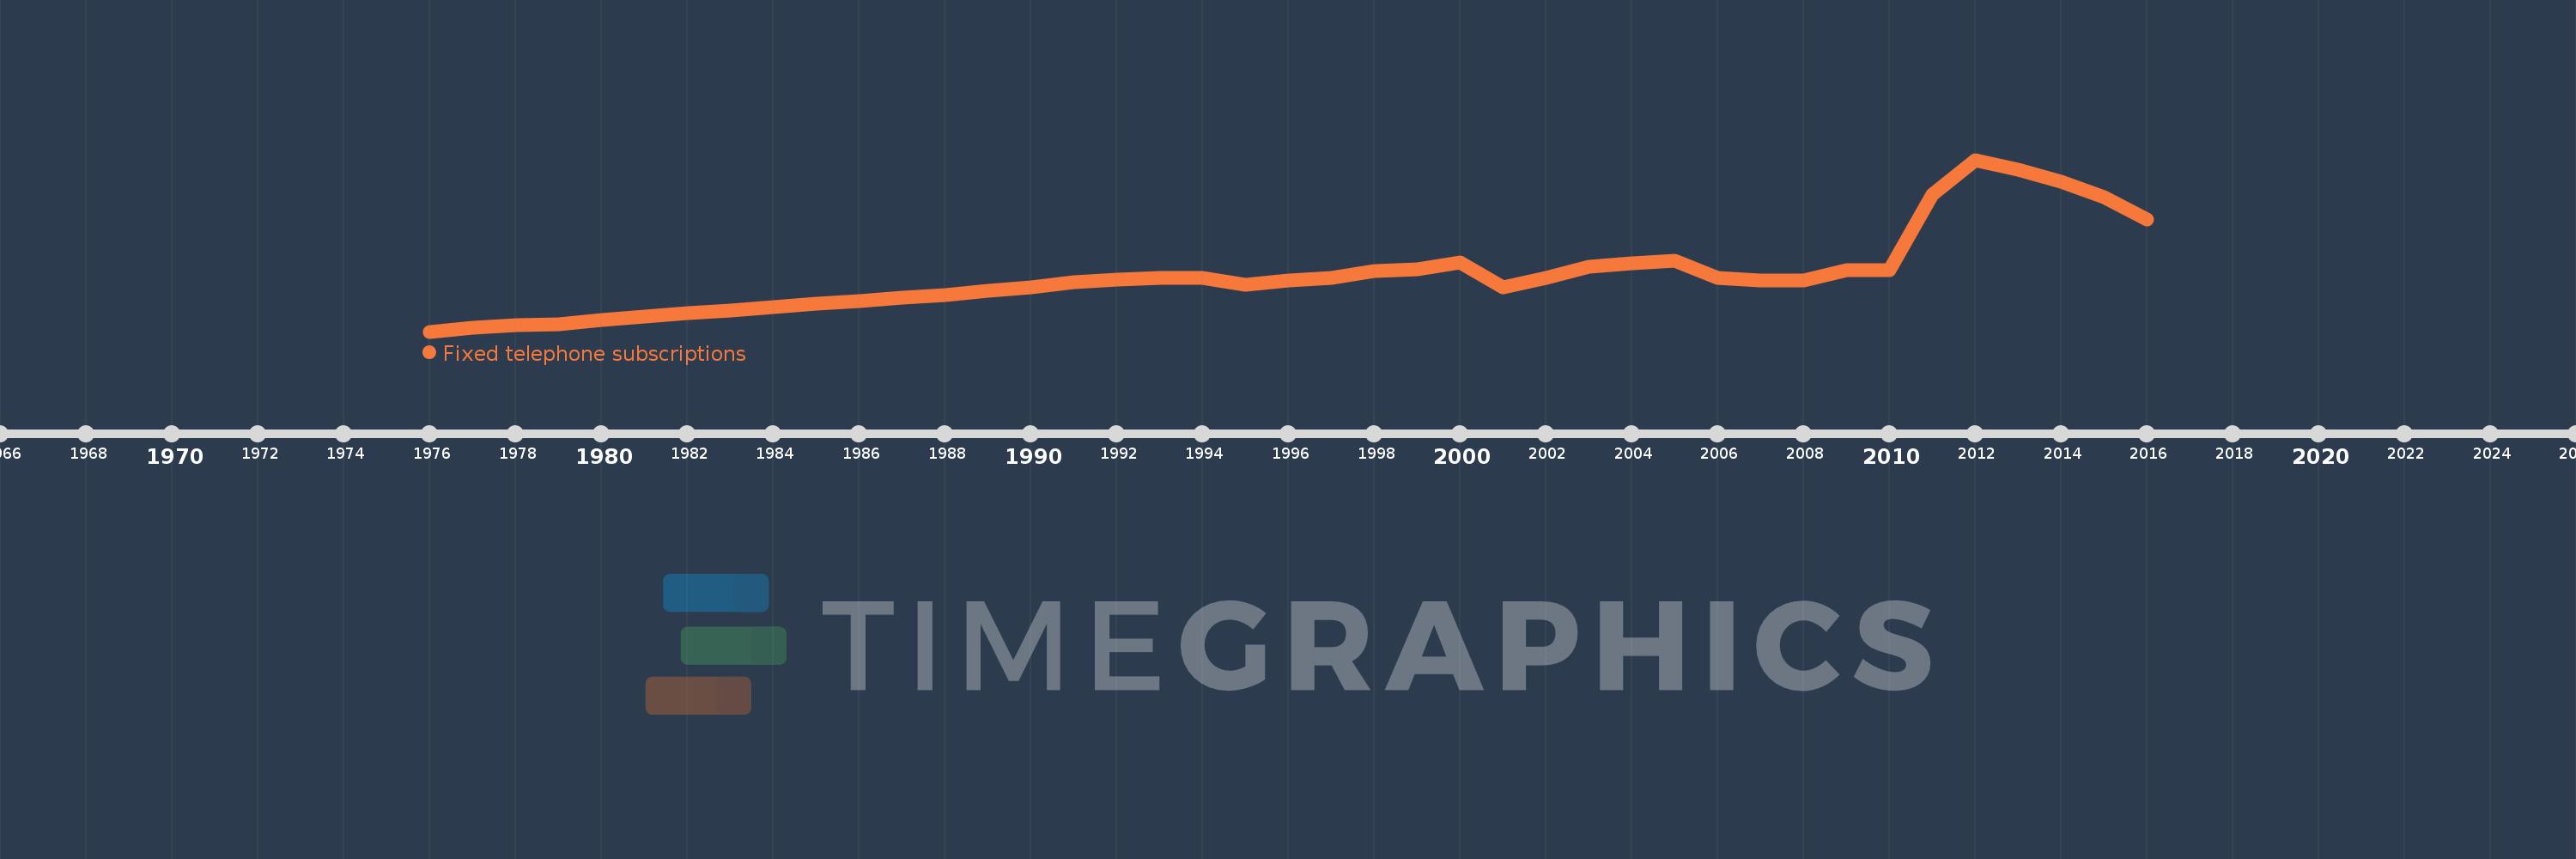
Fixed telephone subscriptions
2016,2015,2014,2013,2012,2011,2010,2009,2008,2007,2006,2005,2004,2003,2002,2001,2000,1999,1998,1997,1996,1995,1994,1993,1992,1991,1990,1989,1988,1987,1986,1985,1984,1983,1982,1981,1980,1979,1978,1977,1976
This statistics in other country:
AfghanistanAlbaniaAlgeriaAmerican SamoaAndorraAngolaAntigua and BarbudaArab WorldArgentinaArmeniaArubaAustraliaAustriaAzerbaijanBahamas, TheBahrainBangladeshBarbadosBelarusBelgiumBelizeBeninBermudaBhutanBoliviaBosnia and HerzegovinaBotswanaBrazilBritish Virgin IslandsBrunei DarussalamBulgariaBurkina FasoBurundiCabo VerdeCambodiaCameroonCanadaCaribbean small statesCayman IslandsCentral African RepublicCentral Europe and the BalticsChadChileChinaColombiaComorosCongo, Dem. Rep.Congo, Rep.Costa RicaCote d'IvoireCroatiaCubaCuracaoCyprusCzech RepublicDenmarkDjiboutiDominicaDominican RepublicEarly-demographic dividendEast Asia & PacificEast Asia & Pacific (excluding high income)East Asia & Pacific (IDA & IBRD countries)EcuadorEgypt, Arab Rep.El SalvadorEquatorial GuineaEritreaEstoniaEthiopiaEuro areaEurope & Central AsiaEurope & Central Asia (excluding high income)Europe & Central Asia (IDA & IBRD countries)European UnionFaroe IslandsFijiFinlandFragile and conflict affected situationsFranceFrench PolynesiaGabonGambia, TheGeorgiaGermanyGhanaGibraltarGreeceGreenlandGrenadaGuamGuatemalaGuineaGuinea-BissauGuyanaHaitiHeavily indebted poor countries (HIPC)High incomeHondurasHong Kong SAR, ChinaHungaryIBRD onlyIcelandIDA & IBRD totalIDA blendIDA onlyIDA totalIndiaIndonesiaIran, Islamic Rep.IraqIrelandIsraelItalyJamaicaJapanJordanKazakhstanKenyaKiribatiKorea, Dem. People’s Rep.Korea, Rep.KosovoKuwaitKyrgyz RepublicLao PDRLate-demographic dividendLatin America & Caribbean Latin America & Caribbean (excluding high income)Latin America & the Caribbean (IDA & IBRD countries)LatviaLeast developed countries: UN classificationLebanonLesothoLiberiaLibyaLiechtensteinLithuaniaLow & middle incomeLow incomeLower middle incomeLuxembourgMacao SAR, ChinaMacedonia, FYRMadagascarMalawiMalaysiaMaldivesMaliMaltaMarshall IslandsMauritaniaMauritiusMexicoMicronesia, Fed. Sts.Middle East & North AfricaMiddle East & North Africa (excluding high income)Middle East & North Africa (IDA & IBRD countries)Middle incomeMoldovaMonacoMongoliaMontenegroMoroccoMozambiqueMyanmarNamibiaNauruNepalNetherlandsNew CaledoniaNew ZealandNicaraguaNigerNigeriaNorth AmericaNorthern Mariana IslandsNorwayOECD membersOmanOther small statesPacific island small statesPakistanPalauPanamaPapua New GuineaParaguayPeruPhilippinesPolandPortugalPost-demographic dividendPre-demographic dividendPuerto RicoQatarRomaniaRussian FederationRwandaSamoaSan MarinoSao Tome and PrincipeSaudi ArabiaSenegalSerbiaSeychellesSierra LeoneSingaporeSlovak RepublicSloveniaSmall statesSolomon IslandsSomaliaSouth AfricaSouth AsiaSouth Asia (IDA & IBRD)South SudanSpainSri LankaSt. Kitts and NevisSt. LuciaSt. Vincent and the GrenadinesSub-Saharan Africa Sub-Saharan Africa (excluding high income)Sub-Saharan Africa (IDA & IBRD countries)SudanSurinameSwazilandSwedenSwitzerlandSyrian Arab RepublicTajikistanTanzaniaThailandTimor-LesteTogoTongaTrinidad and TobagoTunisiaTurkeyTurkmenistanTurks and Caicos IslandsTuvaluUgandaUkraineUnited Arab EmiratesUnited KingdomUnited StatesUpper middle incomeUruguayUzbekistanVanuatuVenezuela, RBVietnamVirgin Islands (U.S.)West Bank and GazaWorldYemen, Rep.ZambiaZimbabwe Timeline:
This timeline shows a graph from 1976 to 2016 of Georgia. No data until 1975. Number of actual observations by date: 41.
Source name:
World Development Indicators
Source organization:
International Telecommunication Union, World Telecommunication/ICT Development Report and database, and World Bank estimates.
Categories, topics:
Infrastructure
Last updated:
apr 23, 2017
Indicators value changes by year
Minimum:
220.0K
jan 1, 1976
Maximum:
1.34 mln
jan 1, 2012
At the date of observation
Value
Absolute change
Change from previous value
jan 1, 1976
220.0K
+220.0K
0.0%
jan 1, 1977
245.0K
+25.0K
11.36%
jan 1, 1978
260.0K
+15.0K
6.12%
jan 1, 1979
270.0K
+10.0K
3.85%
jan 1, 1980
295.0K
+25.0K
9.26%
jan 1, 1981
320.0K
+25.0K
8.47%
jan 1, 1982
340.0K
+20.0K
6.25%
jan 1, 1983
360.0K
+20.0K
5.88%
jan 1, 1984
380.0K
+20.0K
5.56%
jan 1, 1985
400.0K
+20.0K
5.26%
jan 1, 1986
420.0K
+20.0K
5.0%
jan 1, 1987
440.0K
+20.0K
4.76%
jan 1, 1988
460.0K
+20.0K
4.55%
jan 1, 1989
485.0K
+25.0K
5.43%
jan 1, 1990
510.0K
+25.0K
5.15%
jan 1, 1991
540.0K
+30.0K
5.88%
jan 1, 1992
556.8K
+16.8K
3.11%
jan 1, 1993
572.7K
+15.9K
2.86%
jan 1, 1994
570.896K
-1.804K
-0.31%
jan 1, 1995
525.596K
-45.3K
-7.93%
jan 1, 1996
554.3K
+28.704K
5.46%
jan 1, 1997
567.4K
+13.1K
2.36%
jan 1, 1998
616.517K
+49.117K
8.66%
jan 1, 1999
628.77K
+12.253K
1.99%
jan 1, 2000
671.511K
+42.741K
6.8%
jan 1, 2001
508.75K
-162.761K
-24.24%
jan 1, 2002
569.04K
+60.29K
11.85%
jan 1, 2003
640.4K
+71.36K
12.54%
jan 1, 2004
667.12K
+26.72K
4.17%
jan 1, 2005
683.23K
+16.11K
2.41%
jan 1, 2006
570.2K
-113.03K
-16.54%
jan 1, 2007
553.105K
-17.095K
-3.0%
jan 1, 2008
556.1K
+2.995K
0.54%
jan 1, 2009
618.028K
+61.928K
11.14%
jan 1, 2010
620.0K
+1.972K
0.32%
jan 1, 2011
1.112 mln
+491.897K
79.34%
jan 1, 2012
1.34 mln
+228.591K
20.56%
jan 1, 2013
1.276 mln
-64.638K
-4.82%
jan 1, 2014
1.2 mln
-75.564K
-5.92%
jan 1, 2015
1.097 mln
-102.922K
-8.57%
jan 1, 2016
950.167K
-147.197K
-13.41%
Ranking of countries by current statistics by years


Comments: