29
/
en
AIzaSyAYiBZKx7MnpbEhh9jyipgxe19OcubqV5w
April 1, 2024
139243
Germany
DEU
true
2
1
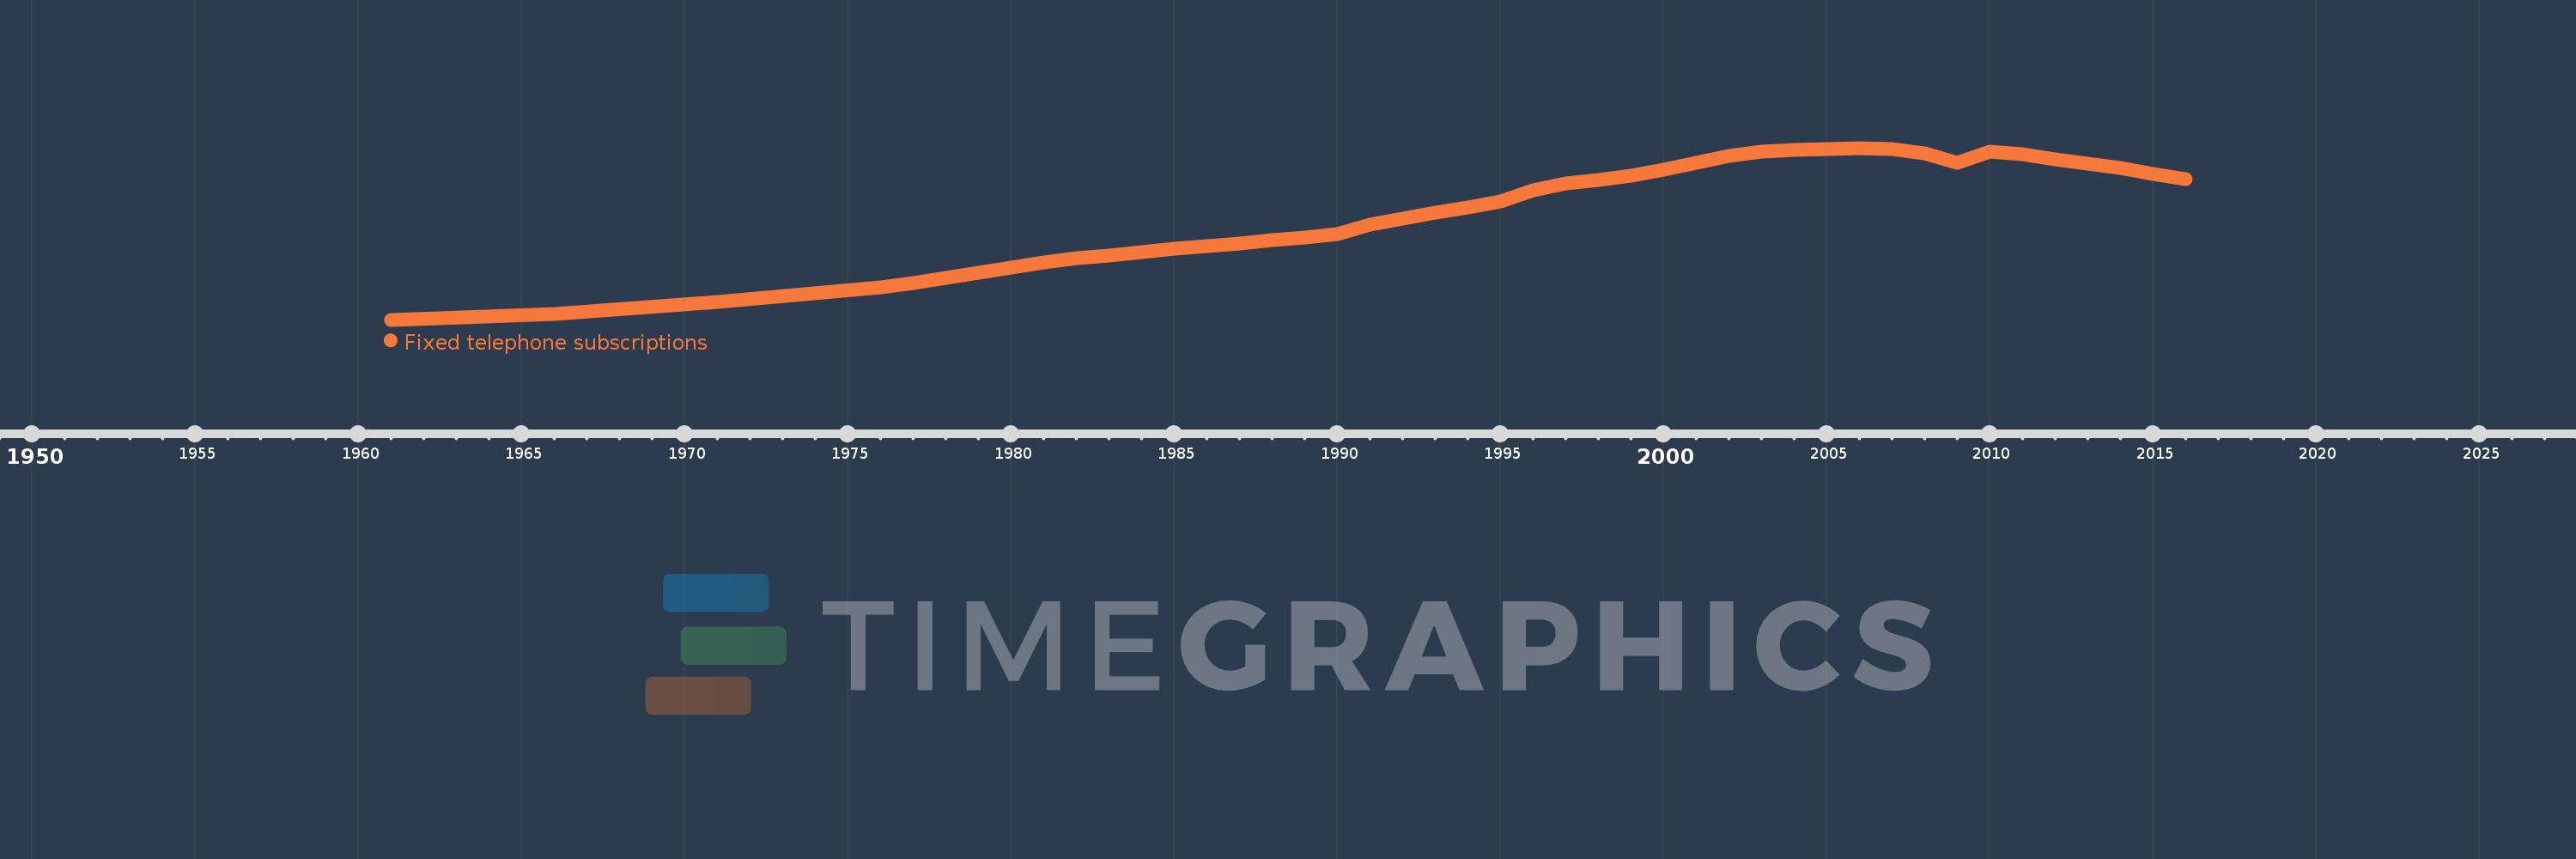
Fixed telephone subscriptions
2016,2015,2014,2013,2012,2011,2010,2009,2008,2007,2006,2005,2004,2003,2002,2001,2000,1999,1998,1997,1996,1995,1994,1993,1992,1991,1990,1989,1988,1987,1986,1985,1984,1983,1982,1981,1980,1979,1978,1977,1976,1971,1966,1961
This statistics in other country:
AfghanistanAlbaniaAlgeriaAmerican SamoaAndorraAngolaAntigua and BarbudaArab WorldArgentinaArmeniaArubaAustraliaAustriaAzerbaijanBahamas, TheBahrainBangladeshBarbadosBelarusBelgiumBelizeBeninBermudaBhutanBoliviaBosnia and HerzegovinaBotswanaBrazilBritish Virgin IslandsBrunei DarussalamBulgariaBurkina FasoBurundiCabo VerdeCambodiaCameroonCanadaCaribbean small statesCayman IslandsCentral African RepublicCentral Europe and the BalticsChadChileChinaColombiaComorosCongo, Dem. Rep.Congo, Rep.Costa RicaCote d'IvoireCroatiaCubaCuracaoCyprusCzech RepublicDenmarkDjiboutiDominicaDominican RepublicEarly-demographic dividendEast Asia & PacificEast Asia & Pacific (excluding high income)East Asia & Pacific (IDA & IBRD countries)EcuadorEgypt, Arab Rep.El SalvadorEquatorial GuineaEritreaEstoniaEthiopiaEuro areaEurope & Central AsiaEurope & Central Asia (excluding high income)Europe & Central Asia (IDA & IBRD countries)European UnionFaroe IslandsFijiFinlandFragile and conflict affected situationsFranceFrench PolynesiaGabonGambia, TheGeorgiaGermanyGhanaGibraltarGreeceGreenlandGrenadaGuamGuatemalaGuineaGuinea-BissauGuyanaHaitiHeavily indebted poor countries (HIPC)High incomeHondurasHong Kong SAR, ChinaHungaryIBRD onlyIcelandIDA & IBRD totalIDA blendIDA onlyIDA totalIndiaIndonesiaIran, Islamic Rep.IraqIrelandIsraelItalyJamaicaJapanJordanKazakhstanKenyaKiribatiKorea, Dem. People’s Rep.Korea, Rep.KosovoKuwaitKyrgyz RepublicLao PDRLate-demographic dividendLatin America & Caribbean Latin America & Caribbean (excluding high income)Latin America & the Caribbean (IDA & IBRD countries)LatviaLeast developed countries: UN classificationLebanonLesothoLiberiaLibyaLiechtensteinLithuaniaLow & middle incomeLow incomeLower middle incomeLuxembourgMacao SAR, ChinaMacedonia, FYRMadagascarMalawiMalaysiaMaldivesMaliMaltaMarshall IslandsMauritaniaMauritiusMexicoMicronesia, Fed. Sts.Middle East & North AfricaMiddle East & North Africa (excluding high income)Middle East & North Africa (IDA & IBRD countries)Middle incomeMoldovaMonacoMongoliaMontenegroMoroccoMozambiqueMyanmarNamibiaNauruNepalNetherlandsNew CaledoniaNew ZealandNicaraguaNigerNigeriaNorth AmericaNorthern Mariana IslandsNorwayOECD membersOmanOther small statesPacific island small statesPakistanPalauPanamaPapua New GuineaParaguayPeruPhilippinesPolandPortugalPost-demographic dividendPre-demographic dividendPuerto RicoQatarRomaniaRussian FederationRwandaSamoaSan MarinoSao Tome and PrincipeSaudi ArabiaSenegalSerbiaSeychellesSierra LeoneSingaporeSlovak RepublicSloveniaSmall statesSolomon IslandsSomaliaSouth AfricaSouth AsiaSouth Asia (IDA & IBRD)South SudanSpainSri LankaSt. Kitts and NevisSt. LuciaSt. Vincent and the GrenadinesSub-Saharan Africa Sub-Saharan Africa (excluding high income)Sub-Saharan Africa (IDA & IBRD countries)SudanSurinameSwazilandSwedenSwitzerlandSyrian Arab RepublicTajikistanTanzaniaThailandTimor-LesteTogoTongaTrinidad and TobagoTunisiaTurkeyTurkmenistanTurks and Caicos IslandsTuvaluUgandaUkraineUnited Arab EmiratesUnited KingdomUnited StatesUpper middle incomeUruguayUzbekistanVanuatuVenezuela, RBVietnamVirgin Islands (U.S.)West Bank and GazaWorldYemen, Rep.ZambiaZimbabwe Timeline:
This timeline shows a graph from 1961 to 2016 of Germany. No data until 1960. Number of actual observations by date: 44.
Source name:
World Development Indicators
Source organization:
International Telecommunication Union, World Telecommunication/ICT Development Report and database, and World Bank estimates.
Categories, topics:
Infrastructure
Last updated:
apr 23, 2017
Indicators value changes by year
Minimum:
3.221 mln
jan 1, 1961
Maximum:
54.791 mln
jan 1, 2006
At the date of observation
Value
Absolute change
Change from previous value
jan 1, 1961
3.221 mln
+3.221 mln
0.0%
jan 1, 1966
4.845 mln
+1.624 mln
50.42%
jan 1, 1971
8.587 mln
+3.742 mln
77.23%
jan 1, 1976
12.834 mln
+4.247 mln
49.46%
jan 1, 1977
14.212 mln
+1.378 mln
10.74%
jan 1, 1978
15.748 mln
+1.536 mln
10.81%
jan 1, 1979
17.305 mln
+1.557 mln
9.89%
jan 1, 1980
18.917 mln
+1.612 mln
9.32%
jan 1, 1981
20.432 mln
+1.515 mln
8.01%
jan 1, 1982
21.646 mln
+1.214 mln
5.94%
jan 1, 1983
22.572 mln
+925.7K
4.28%
jan 1, 1984
23.386 mln
+814.0K
3.61%
jan 1, 1985
24.421 mln
+1.035 mln
4.43%
jan 1, 1986
25.392 mln
+971.2K
3.98%
jan 1, 1987
26.189 mln
+797.5K
3.14%
jan 1, 1988
27.007 mln
+817.8K
3.12%
jan 1, 1989
27.823 mln
+816.1K
3.02%
jan 1, 1990
28.848 mln
+1.025 mln
3.68%
jan 1, 1991
31.887 mln
+3.039 mln
10.54%
jan 1, 1992
33.56 mln
+1.673 mln
5.25%
jan 1, 1993
35.421 mln
+1.861 mln
5.55%
jan 1, 1994
37.0 mln
+1.579 mln
4.46%
jan 1, 1995
38.8 mln
+1.8 mln
4.86%
jan 1, 1996
42.0 mln
+3.2 mln
8.25%
jan 1, 1997
44.1 mln
+2.1 mln
5.0%
jan 1, 1998
45.2 mln
+1.1 mln
2.49%
jan 1, 1999
46.53 mln
+1.33 mln
2.94%
jan 1, 2000
48.21 mln
+1.68 mln
3.61%
jan 1, 2001
50.22 mln
+2.01 mln
4.17%
jan 1, 2002
52.33 mln
+2.11 mln
4.2%
jan 1, 2003
53.67 mln
+1.34 mln
2.56%
jan 1, 2004
54.233 mln
+563.0K
1.05%
jan 1, 2005
54.526 mln
+293.0K
0.54%
jan 1, 2006
54.791 mln
+265.0K
0.49%
jan 1, 2007
54.4 mln
-391.0K
-0.71%
jan 1, 2008
53.1 mln
-1.3 mln
-2.39%
jan 1, 2009
50.3 mln
-2.8 mln
-5.27%
jan 1, 2010
53.7 mln
+3.4 mln
6.76%
jan 1, 2011
52.9 mln
-800.0K
-1.49%
jan 1, 2012
51.4 mln
-1.5 mln
-2.84%
jan 1, 2013
50.1 mln
-1.3 mln
-2.53%
jan 1, 2014
48.7 mln
-1.4 mln
-2.79%
jan 1, 2015
47.021 mln
-1.679 mln
-3.45%
jan 1, 2016
45.352 mln
-1.669 mln
-3.55%
Ranking of countries by current statistics by years


Comments: