29
/
en
AIzaSyAYiBZKx7MnpbEhh9jyipgxe19OcubqV5w
April 1, 2024
55505
Pre-demographic dividend
PRE
false
2
1
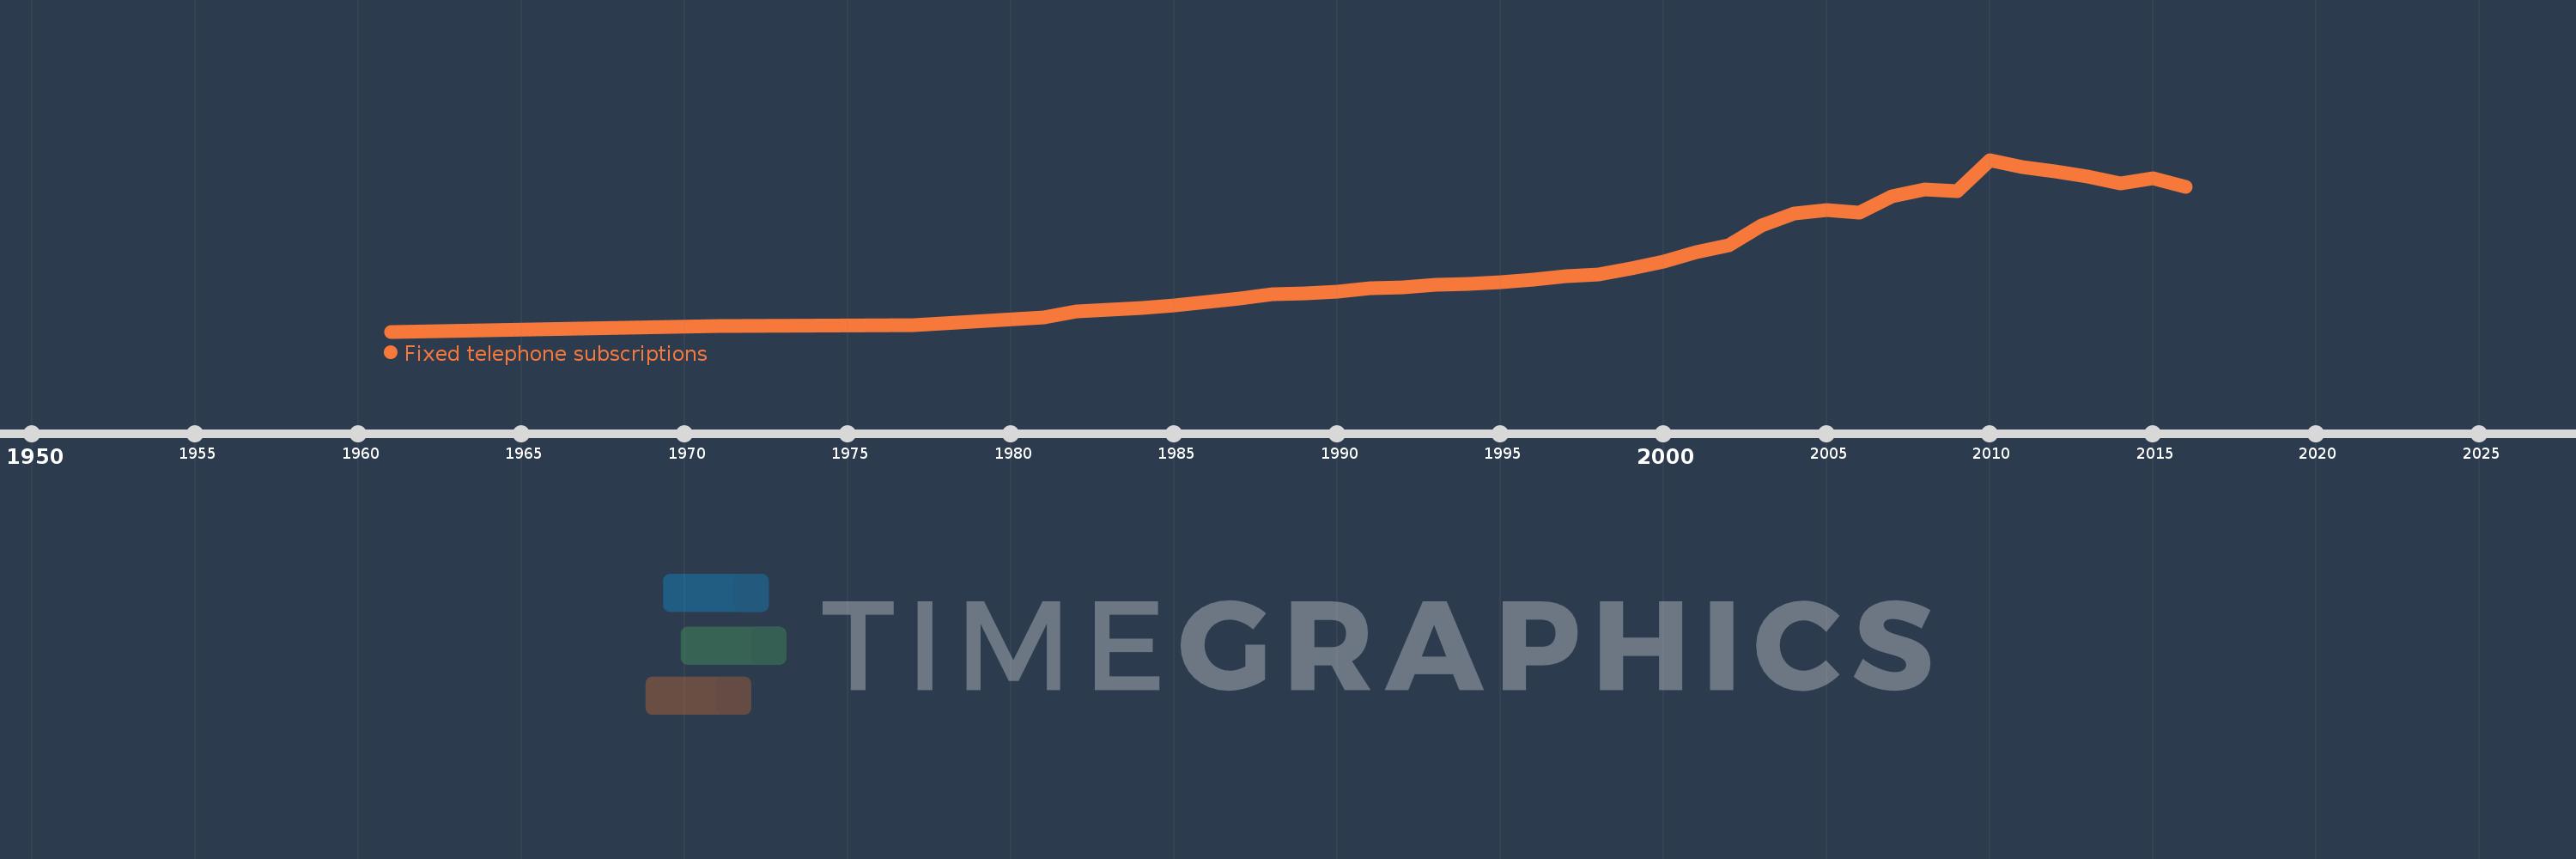
Fixed telephone subscriptions
2016,2015,2014,2013,2012,2011,2010,2009,2008,2007,2006,2005,2004,2003,2002,2001,2000,1999,1998,1997,1996,1995,1994,1993,1992,1991,1990,1989,1988,1987,1986,1985,1984,1983,1982,1981,1977,1971,1961
This statistics in other country:
AfghanistanAlbaniaAlgeriaAmerican SamoaAndorraAngolaAntigua and BarbudaArab WorldArgentinaArmeniaArubaAustraliaAustriaAzerbaijanBahamas, TheBahrainBangladeshBarbadosBelarusBelgiumBelizeBeninBermudaBhutanBoliviaBosnia and HerzegovinaBotswanaBrazilBritish Virgin IslandsBrunei DarussalamBulgariaBurkina FasoBurundiCabo VerdeCambodiaCameroonCanadaCaribbean small statesCayman IslandsCentral African RepublicCentral Europe and the BalticsChadChileChinaColombiaComorosCongo, Dem. Rep.Congo, Rep.Costa RicaCote d'IvoireCroatiaCubaCuracaoCyprusCzech RepublicDenmarkDjiboutiDominicaDominican RepublicEarly-demographic dividendEast Asia & PacificEast Asia & Pacific (excluding high income)East Asia & Pacific (IDA & IBRD countries)EcuadorEgypt, Arab Rep.El SalvadorEquatorial GuineaEritreaEstoniaEthiopiaEuro areaEurope & Central AsiaEurope & Central Asia (excluding high income)Europe & Central Asia (IDA & IBRD countries)European UnionFaroe IslandsFijiFinlandFragile and conflict affected situationsFranceFrench PolynesiaGabonGambia, TheGeorgiaGermanyGhanaGibraltarGreeceGreenlandGrenadaGuamGuatemalaGuineaGuinea-BissauGuyanaHaitiHeavily indebted poor countries (HIPC)High incomeHondurasHong Kong SAR, ChinaHungaryIBRD onlyIcelandIDA & IBRD totalIDA blendIDA onlyIDA totalIndiaIndonesiaIran, Islamic Rep.IraqIrelandIsraelItalyJamaicaJapanJordanKazakhstanKenyaKiribatiKorea, Dem. People’s Rep.Korea, Rep.KosovoKuwaitKyrgyz RepublicLao PDRLate-demographic dividendLatin America & Caribbean Latin America & Caribbean (excluding high income)Latin America & the Caribbean (IDA & IBRD countries)LatviaLeast developed countries: UN classificationLebanonLesothoLiberiaLibyaLiechtensteinLithuaniaLow & middle incomeLow incomeLower middle incomeLuxembourgMacao SAR, ChinaMacedonia, FYRMadagascarMalawiMalaysiaMaldivesMaliMaltaMarshall IslandsMauritaniaMauritiusMexicoMicronesia, Fed. Sts.Middle East & North AfricaMiddle East & North Africa (excluding high income)Middle East & North Africa (IDA & IBRD countries)Middle incomeMoldovaMonacoMongoliaMontenegroMoroccoMozambiqueMyanmarNamibiaNauruNepalNetherlandsNew CaledoniaNew ZealandNicaraguaNigerNigeriaNorth AmericaNorthern Mariana IslandsNorwayOECD membersOmanOther small statesPacific island small statesPakistanPalauPanamaPapua New GuineaParaguayPeruPhilippinesPolandPortugalPost-demographic dividendPre-demographic dividendPuerto RicoQatarRomaniaRussian FederationRwandaSamoaSan MarinoSao Tome and PrincipeSaudi ArabiaSenegalSerbiaSeychellesSierra LeoneSingaporeSlovak RepublicSloveniaSmall statesSolomon IslandsSomaliaSouth AfricaSouth AsiaSouth Asia (IDA & IBRD)South SudanSpainSri LankaSt. Kitts and NevisSt. LuciaSt. Vincent and the GrenadinesSub-Saharan Africa Sub-Saharan Africa (excluding high income)Sub-Saharan Africa (IDA & IBRD countries)SudanSurinameSwazilandSwedenSwitzerlandSyrian Arab RepublicTajikistanTanzaniaThailandTimor-LesteTogoTongaTrinidad and TobagoTunisiaTurkeyTurkmenistanTurks and Caicos IslandsTuvaluUgandaUkraineUnited Arab EmiratesUnited KingdomUnited StatesUpper middle incomeUruguayUzbekistanVanuatuVenezuela, RBVietnamVirgin Islands (U.S.)West Bank and GazaWorldYemen, Rep.ZambiaZimbabwe Timeline:
This timeline shows a graph from 1961 to 2016 of Pre-demographic dividend. No data until 1960. Number of actual observations by date: 39.
Source name:
World Development Indicators
Source organization:
International Telecommunication Union, World Telecommunication/ICT Development Report and database, and World Bank estimates.
Categories, topics:
Infrastructure
Last updated:
apr 23, 2017
Indicators value changes by year
Minimum:
117.84K
jan 1, 1961
Maximum:
7.491 mln
jan 1, 2010
At the date of observation
Value
Absolute change
Change from previous value
jan 1, 1961
117.84K
+117.84K
0.0%
jan 1, 1971
366.759K
+248.919K
211.23%
jan 1, 1977
396.606K
+29.847K
8.14%
jan 1, 1981
742.962K
+346.356K
87.33%
jan 1, 1982
996.646K
+253.684K
34.14%
jan 1, 1983
1.053 mln
+56.105K
5.63%
jan 1, 1984
1.139 mln
+86.143K
8.18%
jan 1, 1985
1.254 mln
+115.089K
10.11%
jan 1, 1986
1.389 mln
+134.961K
10.76%
jan 1, 1987
1.538 mln
+149.043K
10.73%
jan 1, 1988
1.712 mln
+173.652K
11.29%
jan 1, 1989
1.774 mln
+62.36K
3.64%
jan 1, 1990
1.84 mln
+66.453K
3.75%
jan 1, 1991
1.974 mln
+133.252K
7.24%
jan 1, 1992
2.008 mln
+34.512K
1.75%
jan 1, 1993
2.133 mln
+124.365K
6.19%
jan 1, 1994
2.162 mln
+29.53K
1.38%
jan 1, 1995
2.233 mln
+70.69K
3.27%
jan 1, 1996
2.364 mln
+131.139K
5.87%
jan 1, 1997
2.486 mln
+122.284K
5.17%
jan 1, 1998
2.584 mln
+97.765K
3.93%
jan 1, 1999
2.823 mln
+239.454K
9.27%
jan 1, 2000
3.139 mln
+315.404K
11.17%
jan 1, 2001
3.531 mln
+392.398K
12.5%
jan 1, 2002
3.813 mln
+281.613K
7.97%
jan 1, 2003
4.679 mln
+866.131K
22.72%
jan 1, 2004
5.187 mln
+508.347K
10.86%
jan 1, 2005
5.325 mln
+138.07K
2.66%
jan 1, 2006
5.237 mln
-88.749K
-1.67%
jan 1, 2007
5.941 mln
+703.89K
13.44%
jan 1, 2008
6.211 mln
+270.222K
4.55%
jan 1, 2009
6.148 mln
-62.84K
-1.01%
jan 1, 2010
7.491 mln
+1.343 mln
21.85%
jan 1, 2011
7.192 mln
-299.845K
-4.0%
jan 1, 2012
6.991 mln
-200.185K
-2.78%
jan 1, 2013
6.775 mln
-215.909K
-3.09%
jan 1, 2014
6.484 mln
-291.729K
-4.31%
jan 1, 2015
6.705 mln
+220.831K
3.41%
jan 1, 2016
6.327 mln
-377.223K
-5.63%
Ranking of countries by current statistics by years


Comments: