29
/
en
AIzaSyAYiBZKx7MnpbEhh9jyipgxe19OcubqV5w
April 1, 2024
97302
Cabo Verde
CPV
true
2
1
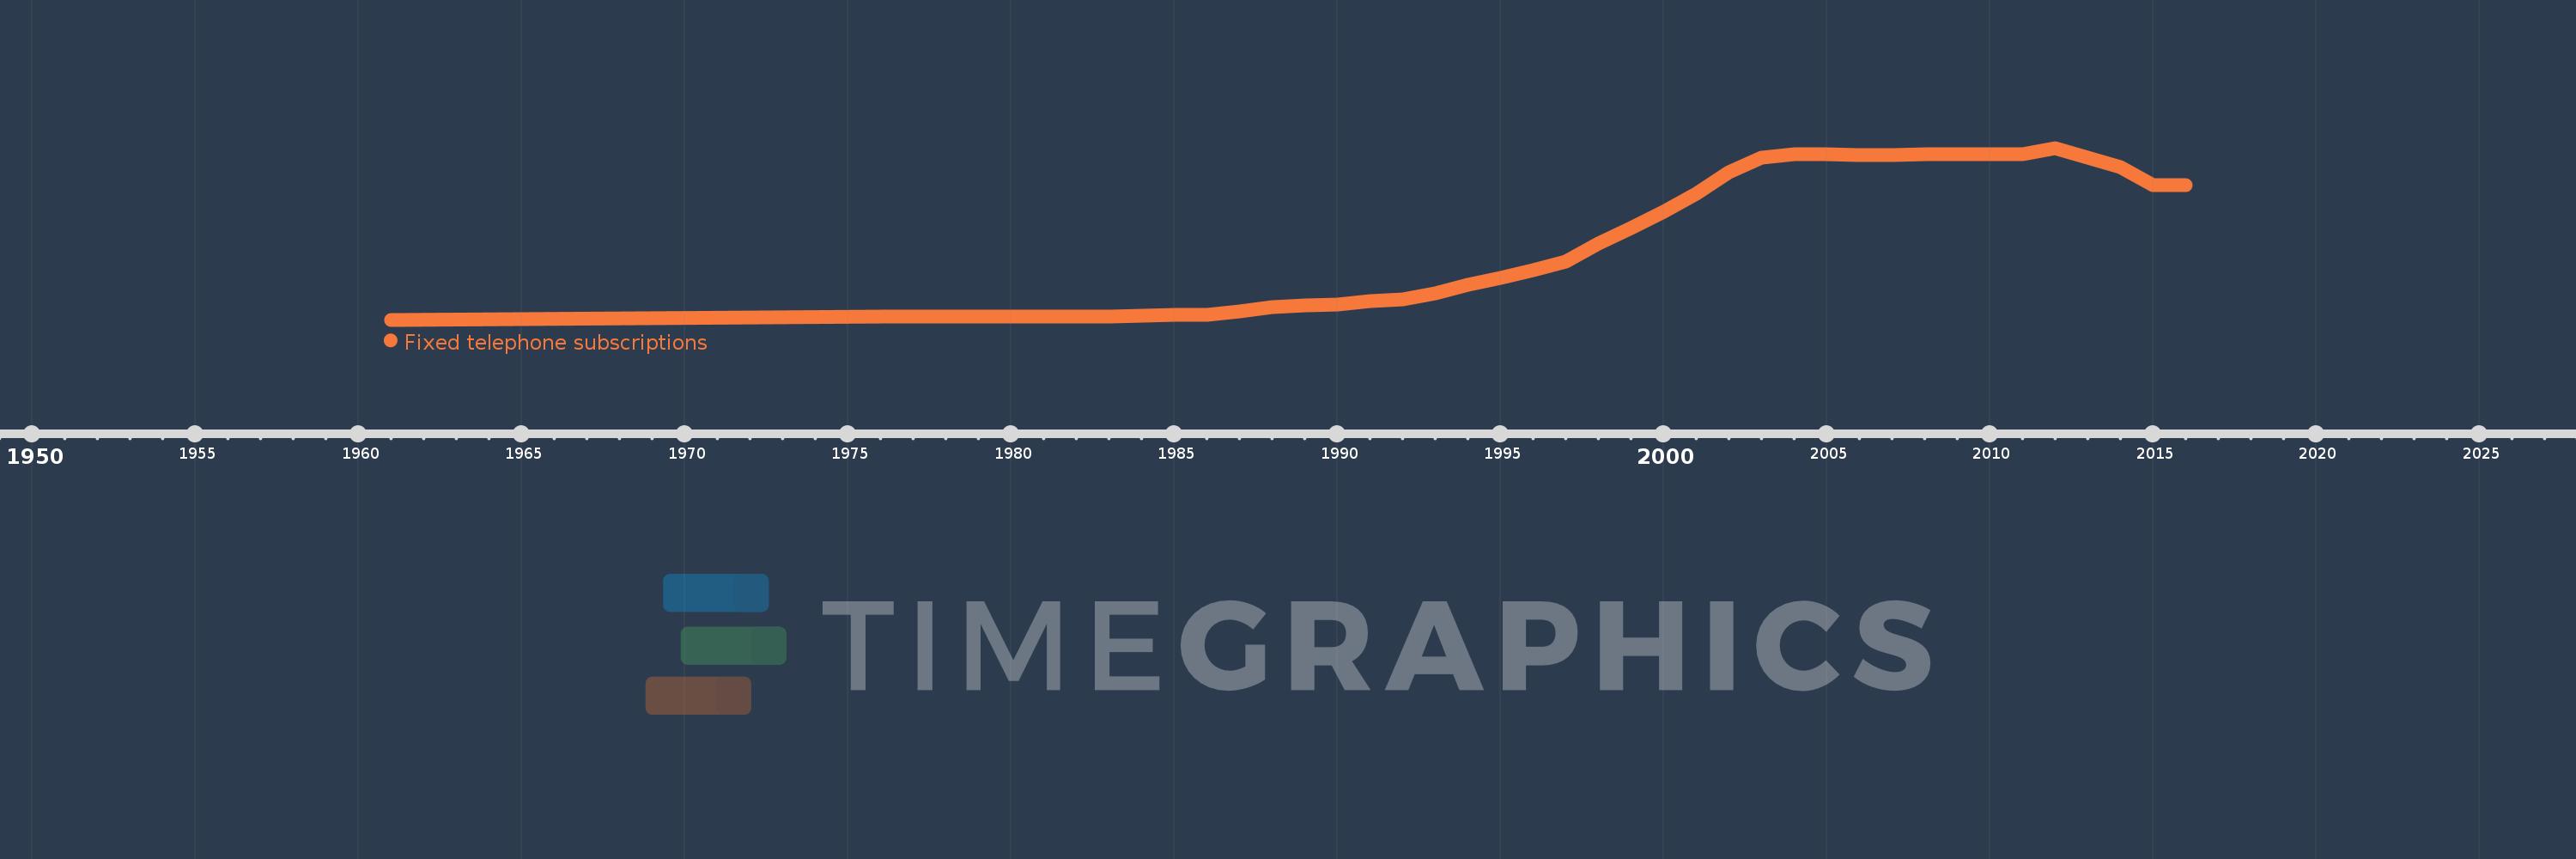
Fixed telephone subscriptions
2016,2015,2014,2013,2012,2011,2010,2009,2008,2007,2006,2005,2004,2003,2002,2001,2000,1999,1998,1997,1996,1995,1994,1993,1992,1991,1990,1989,1988,1987,1986,1985,1984,1983,1982,1981,1976,1961
This statistics in other country:
AfghanistanAlbaniaAlgeriaAmerican SamoaAndorraAngolaAntigua and BarbudaArab WorldArgentinaArmeniaArubaAustraliaAustriaAzerbaijanBahamas, TheBahrainBangladeshBarbadosBelarusBelgiumBelizeBeninBermudaBhutanBoliviaBosnia and HerzegovinaBotswanaBrazilBritish Virgin IslandsBrunei DarussalamBulgariaBurkina FasoBurundiCabo VerdeCambodiaCameroonCanadaCaribbean small statesCayman IslandsCentral African RepublicCentral Europe and the BalticsChadChileChinaColombiaComorosCongo, Dem. Rep.Congo, Rep.Costa RicaCote d'IvoireCroatiaCubaCuracaoCyprusCzech RepublicDenmarkDjiboutiDominicaDominican RepublicEarly-demographic dividendEast Asia & PacificEast Asia & Pacific (excluding high income)East Asia & Pacific (IDA & IBRD countries)EcuadorEgypt, Arab Rep.El SalvadorEquatorial GuineaEritreaEstoniaEthiopiaEuro areaEurope & Central AsiaEurope & Central Asia (excluding high income)Europe & Central Asia (IDA & IBRD countries)European UnionFaroe IslandsFijiFinlandFragile and conflict affected situationsFranceFrench PolynesiaGabonGambia, TheGeorgiaGermanyGhanaGibraltarGreeceGreenlandGrenadaGuamGuatemalaGuineaGuinea-BissauGuyanaHaitiHeavily indebted poor countries (HIPC)High incomeHondurasHong Kong SAR, ChinaHungaryIBRD onlyIcelandIDA & IBRD totalIDA blendIDA onlyIDA totalIndiaIndonesiaIran, Islamic Rep.IraqIrelandIsraelItalyJamaicaJapanJordanKazakhstanKenyaKiribatiKorea, Dem. People’s Rep.Korea, Rep.KosovoKuwaitKyrgyz RepublicLao PDRLate-demographic dividendLatin America & Caribbean Latin America & Caribbean (excluding high income)Latin America & the Caribbean (IDA & IBRD countries)LatviaLeast developed countries: UN classificationLebanonLesothoLiberiaLibyaLiechtensteinLithuaniaLow & middle incomeLow incomeLower middle incomeLuxembourgMacao SAR, ChinaMacedonia, FYRMadagascarMalawiMalaysiaMaldivesMaliMaltaMarshall IslandsMauritaniaMauritiusMexicoMicronesia, Fed. Sts.Middle East & North AfricaMiddle East & North Africa (excluding high income)Middle East & North Africa (IDA & IBRD countries)Middle incomeMoldovaMonacoMongoliaMontenegroMoroccoMozambiqueMyanmarNamibiaNauruNepalNetherlandsNew CaledoniaNew ZealandNicaraguaNigerNigeriaNorth AmericaNorthern Mariana IslandsNorwayOECD membersOmanOther small statesPacific island small statesPakistanPalauPanamaPapua New GuineaParaguayPeruPhilippinesPolandPortugalPost-demographic dividendPre-demographic dividendPuerto RicoQatarRomaniaRussian FederationRwandaSamoaSan MarinoSao Tome and PrincipeSaudi ArabiaSenegalSerbiaSeychellesSierra LeoneSingaporeSlovak RepublicSloveniaSmall statesSolomon IslandsSomaliaSouth AfricaSouth AsiaSouth Asia (IDA & IBRD)South SudanSpainSri LankaSt. Kitts and NevisSt. LuciaSt. Vincent and the GrenadinesSub-Saharan Africa Sub-Saharan Africa (excluding high income)Sub-Saharan Africa (IDA & IBRD countries)SudanSurinameSwazilandSwedenSwitzerlandSyrian Arab RepublicTajikistanTanzaniaThailandTimor-LesteTogoTongaTrinidad and TobagoTunisiaTurkeyTurkmenistanTurks and Caicos IslandsTuvaluUgandaUkraineUnited Arab EmiratesUnited KingdomUnited StatesUpper middle incomeUruguayUzbekistanVanuatuVenezuela, RBVietnamVirgin Islands (U.S.)West Bank and GazaWorldYemen, Rep.ZambiaZimbabwe Timeline:
This timeline shows a graph from 1961 to 2016 of Cabo Verde. No data until 1960. Number of actual observations by date: 38.
Source name:
World Development Indicators
Source organization:
International Telecommunication Union, World Telecommunication/ICT Development Report and database, and World Bank estimates.
Categories, topics:
Infrastructure
Last updated:
apr 23, 2017
Indicators value changes by year
Maximum:
74.503K
jan 1, 2012
At the date of observation
Value
Absolute change
Change from previous value
jan 1, 1961
188.0
+188.0
0.0%
jan 1, 1976
1.49K
+1.302K
692.55%
jan 1, 1981
1.439K
-51.0
-3.42%
jan 1, 1982
1.565K
+126.1
8.76%
jan 1, 1983
1.7K
+134.9
8.62%
jan 1, 1984
1.89K
+190.0
11.18%
jan 1, 1985
2.19K
+300.0
15.87%
jan 1, 1986
2.282K
+92.0
4.2%
jan 1, 1987
3.722K
+1.44K
63.1%
jan 1, 1988
5.614K
+1.892K
50.83%
jan 1, 1989
6.406K
+792.0
14.11%
jan 1, 1990
6.8K
+394.0
6.15%
jan 1, 1991
8.246K
+1.446K
21.26%
jan 1, 1992
9.095K
+849.0
10.3%
jan 1, 1993
11.629K
+2.534K
27.86%
jan 1, 1994
15.252K
+3.623K
31.15%
jan 1, 1995
18.45K
+3.198K
20.97%
jan 1, 1996
21.513K
+3.063K
16.6%
jan 1, 1997
25.232K
+3.719K
17.29%
jan 1, 1998
33.241K
+8.009K
31.74%
jan 1, 1999
39.985K
+6.744K
20.29%
jan 1, 2000
46.865K
+6.88K
17.21%
jan 1, 2001
54.644K
+7.779K
16.6%
jan 1, 2002
64.132K
+9.488K
17.36%
jan 1, 2003
70.187K
+6.055K
9.44%
jan 1, 2004
71.716K
+1.529K
2.18%
jan 1, 2005
71.7K
-16.0
-0.02%
jan 1, 2006
71.6K
-100.0
-0.14%
jan 1, 2007
71.578K
-22.0
-0.03%
jan 1, 2008
71.764K
+186.0
0.26%
jan 1, 2009
71.86K
+96.0
0.13%
jan 1, 2010
71.874K
+14.0
0.02%
jan 1, 2011
71.971K
+97.0
0.13%
jan 1, 2012
74.503K
+2.532K
3.52%
jan 1, 2013
70.22K
-4.283K
-5.75%
jan 1, 2014
66.177K
-4.043K
-5.76%
jan 1, 2015
58.534K
-7.643K
-11.55%
jan 1, 2016
58.456K
-78.0
-0.13%
Ranking of countries by current statistics by years


Comments: