29
/
en
AIzaSyAYiBZKx7MnpbEhh9jyipgxe19OcubqV5w
April 1, 2024
122101
Dominican Republic
DOM
true
2
1
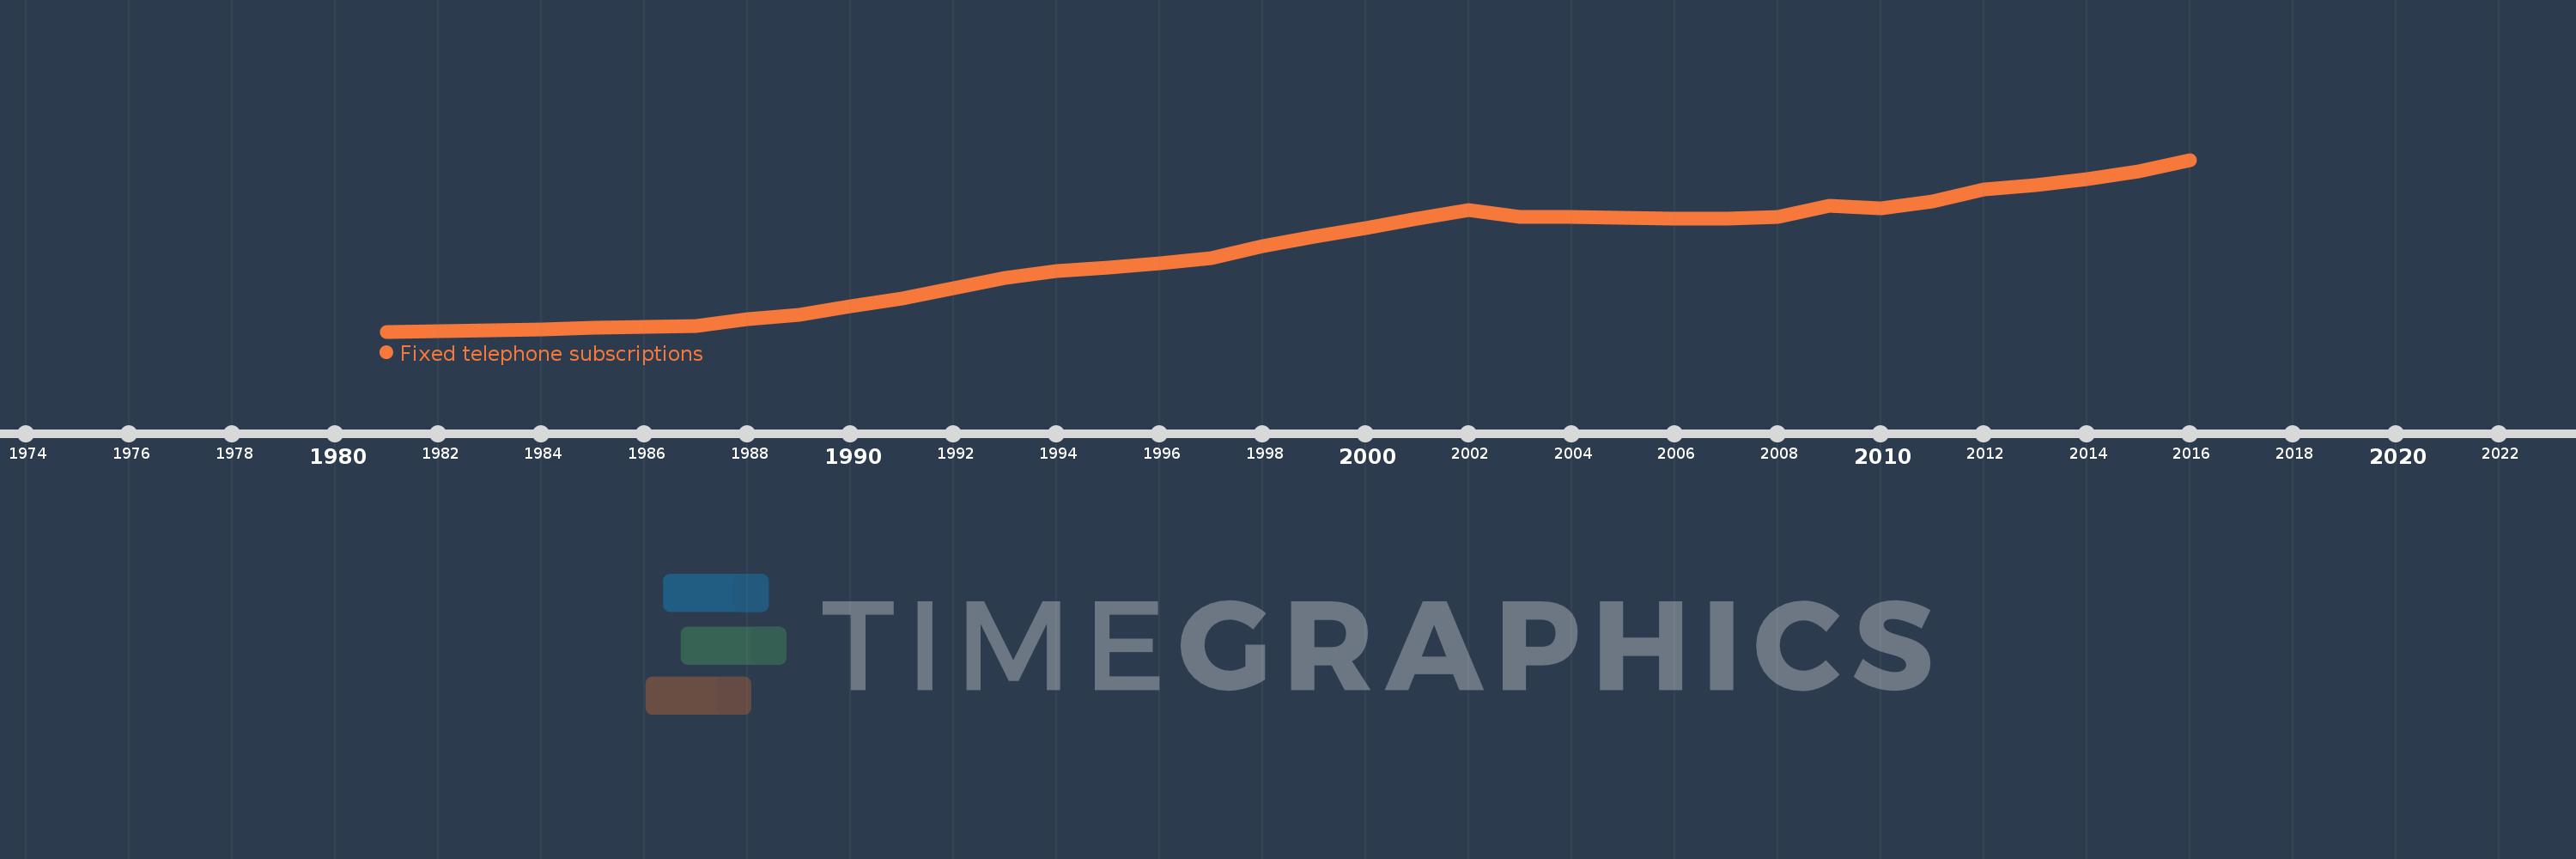
Fixed telephone subscriptions
2016,2015,2014,2013,2012,2011,2010,2009,2008,2007,2006,2005,2004,2003,2002,2001,2000,1999,1998,1997,1996,1995,1994,1993,1992,1991,1990,1989,1988,1987,1986,1985,1984,1983,1982,1981
This statistics in other country:
AfghanistanAlbaniaAlgeriaAmerican SamoaAndorraAngolaAntigua and BarbudaArab WorldArgentinaArmeniaArubaAustraliaAustriaAzerbaijanBahamas, TheBahrainBangladeshBarbadosBelarusBelgiumBelizeBeninBermudaBhutanBoliviaBosnia and HerzegovinaBotswanaBrazilBritish Virgin IslandsBrunei DarussalamBulgariaBurkina FasoBurundiCabo VerdeCambodiaCameroonCanadaCaribbean small statesCayman IslandsCentral African RepublicCentral Europe and the BalticsChadChileChinaColombiaComorosCongo, Dem. Rep.Congo, Rep.Costa RicaCote d'IvoireCroatiaCubaCuracaoCyprusCzech RepublicDenmarkDjiboutiDominicaDominican RepublicEarly-demographic dividendEast Asia & PacificEast Asia & Pacific (excluding high income)East Asia & Pacific (IDA & IBRD countries)EcuadorEgypt, Arab Rep.El SalvadorEquatorial GuineaEritreaEstoniaEthiopiaEuro areaEurope & Central AsiaEurope & Central Asia (excluding high income)Europe & Central Asia (IDA & IBRD countries)European UnionFaroe IslandsFijiFinlandFragile and conflict affected situationsFranceFrench PolynesiaGabonGambia, TheGeorgiaGermanyGhanaGibraltarGreeceGreenlandGrenadaGuamGuatemalaGuineaGuinea-BissauGuyanaHaitiHeavily indebted poor countries (HIPC)High incomeHondurasHong Kong SAR, ChinaHungaryIBRD onlyIcelandIDA & IBRD totalIDA blendIDA onlyIDA totalIndiaIndonesiaIran, Islamic Rep.IraqIrelandIsraelItalyJamaicaJapanJordanKazakhstanKenyaKiribatiKorea, Dem. People’s Rep.Korea, Rep.KosovoKuwaitKyrgyz RepublicLao PDRLate-demographic dividendLatin America & Caribbean Latin America & Caribbean (excluding high income)Latin America & the Caribbean (IDA & IBRD countries)LatviaLeast developed countries: UN classificationLebanonLesothoLiberiaLibyaLiechtensteinLithuaniaLow & middle incomeLow incomeLower middle incomeLuxembourgMacao SAR, ChinaMacedonia, FYRMadagascarMalawiMalaysiaMaldivesMaliMaltaMarshall IslandsMauritaniaMauritiusMexicoMicronesia, Fed. Sts.Middle East & North AfricaMiddle East & North Africa (excluding high income)Middle East & North Africa (IDA & IBRD countries)Middle incomeMoldovaMonacoMongoliaMontenegroMoroccoMozambiqueMyanmarNamibiaNauruNepalNetherlandsNew CaledoniaNew ZealandNicaraguaNigerNigeriaNorth AmericaNorthern Mariana IslandsNorwayOECD membersOmanOther small statesPacific island small statesPakistanPalauPanamaPapua New GuineaParaguayPeruPhilippinesPolandPortugalPost-demographic dividendPre-demographic dividendPuerto RicoQatarRomaniaRussian FederationRwandaSamoaSan MarinoSao Tome and PrincipeSaudi ArabiaSenegalSerbiaSeychellesSierra LeoneSingaporeSlovak RepublicSloveniaSmall statesSolomon IslandsSomaliaSouth AfricaSouth AsiaSouth Asia (IDA & IBRD)South SudanSpainSri LankaSt. Kitts and NevisSt. LuciaSt. Vincent and the GrenadinesSub-Saharan Africa Sub-Saharan Africa (excluding high income)Sub-Saharan Africa (IDA & IBRD countries)SudanSurinameSwazilandSwedenSwitzerlandSyrian Arab RepublicTajikistanTanzaniaThailandTimor-LesteTogoTongaTrinidad and TobagoTunisiaTurkeyTurkmenistanTurks and Caicos IslandsTuvaluUgandaUkraineUnited Arab EmiratesUnited KingdomUnited StatesUpper middle incomeUruguayUzbekistanVanuatuVenezuela, RBVietnamVirgin Islands (U.S.)West Bank and GazaWorldYemen, Rep.ZambiaZimbabwe Timeline:
This timeline shows a graph from 1981 to 2016 of Dominican Republic. No data until 1980. Number of actual observations by date: 36.
Source name:
World Development Indicators
Source organization:
International Telecommunication Union, World Telecommunication/ICT Development Report and database, and World Bank estimates.
Categories, topics:
Infrastructure
Last updated:
apr 23, 2017
Indicators value changes by year
Minimum:
108.5K
jan 1, 1981
Maximum:
1.305 mln
jan 1, 2016
At the date of observation
Value
Absolute change
Change from previous value
jan 1, 1981
108.5K
+108.5K
0.0%
jan 1, 1982
113.9K
+5.4K
4.98%
jan 1, 1983
118.4K
+4.5K
3.95%
jan 1, 1984
125.3K
+6.9K
5.83%
jan 1, 1985
134.1K
+8.8K
7.02%
jan 1, 1986
143.7K
+9.6K
7.16%
jan 1, 1987
148.2K
+4.5K
3.13%
jan 1, 1988
193.4K
+45.2K
30.5%
jan 1, 1989
227.0K
+33.6K
17.37%
jan 1, 1990
284.0K
+57.0K
25.11%
jan 1, 1991
341.201K
+57.201K
20.14%
jan 1, 1992
410.542K
+69.341K
20.32%
jan 1, 1993
479.48K
+68.938K
16.79%
jan 1, 1994
529.981K
+50.501K
10.53%
jan 1, 1995
555.449K
+25.468K
4.81%
jan 1, 1996
582.611K
+27.162K
4.89%
jan 1, 1997
618.551K
+35.94K
6.17%
jan 1, 1998
704.389K
+85.838K
13.88%
jan 1, 1999
772.18K
+67.791K
9.62%
jan 1, 2000
826.746K
+54.566K
7.07%
jan 1, 2001
894.164K
+67.418K
8.15%
jan 1, 2002
955.145K
+60.981K
6.82%
jan 1, 2003
908.957K
-46.188K
-4.84%
jan 1, 2004
908.809K
-148.0
-0.02%
jan 1, 2005
902.258K
-6.551K
-0.72%
jan 1, 2006
896.252K
-6.006K
-0.67%
jan 1, 2007
897.026K
+774.0
0.09%
jan 1, 2008
906.485K
+9.459K
1.05%
jan 1, 2009
985.711K
+79.226K
8.74%
jan 1, 2010
965.423K
-20.288K
-2.06%
jan 1, 2011
1.013 mln
+47.489K
4.92%
jan 1, 2012
1.1 mln
+86.878K
8.58%
jan 1, 2013
1.129 mln
+29.157K
2.65%
jan 1, 2014
1.171 mln
+42.102K
3.73%
jan 1, 2015
1.226 mln
+55.06K
4.7%
jan 1, 2016
1.305 mln
+78.859K
6.43%
Ranking of countries by current statistics by years


Comments: