29
/
en
AIzaSyAYiBZKx7MnpbEhh9jyipgxe19OcubqV5w
April 1, 2024
159384
Ireland
IRL
true
2
1
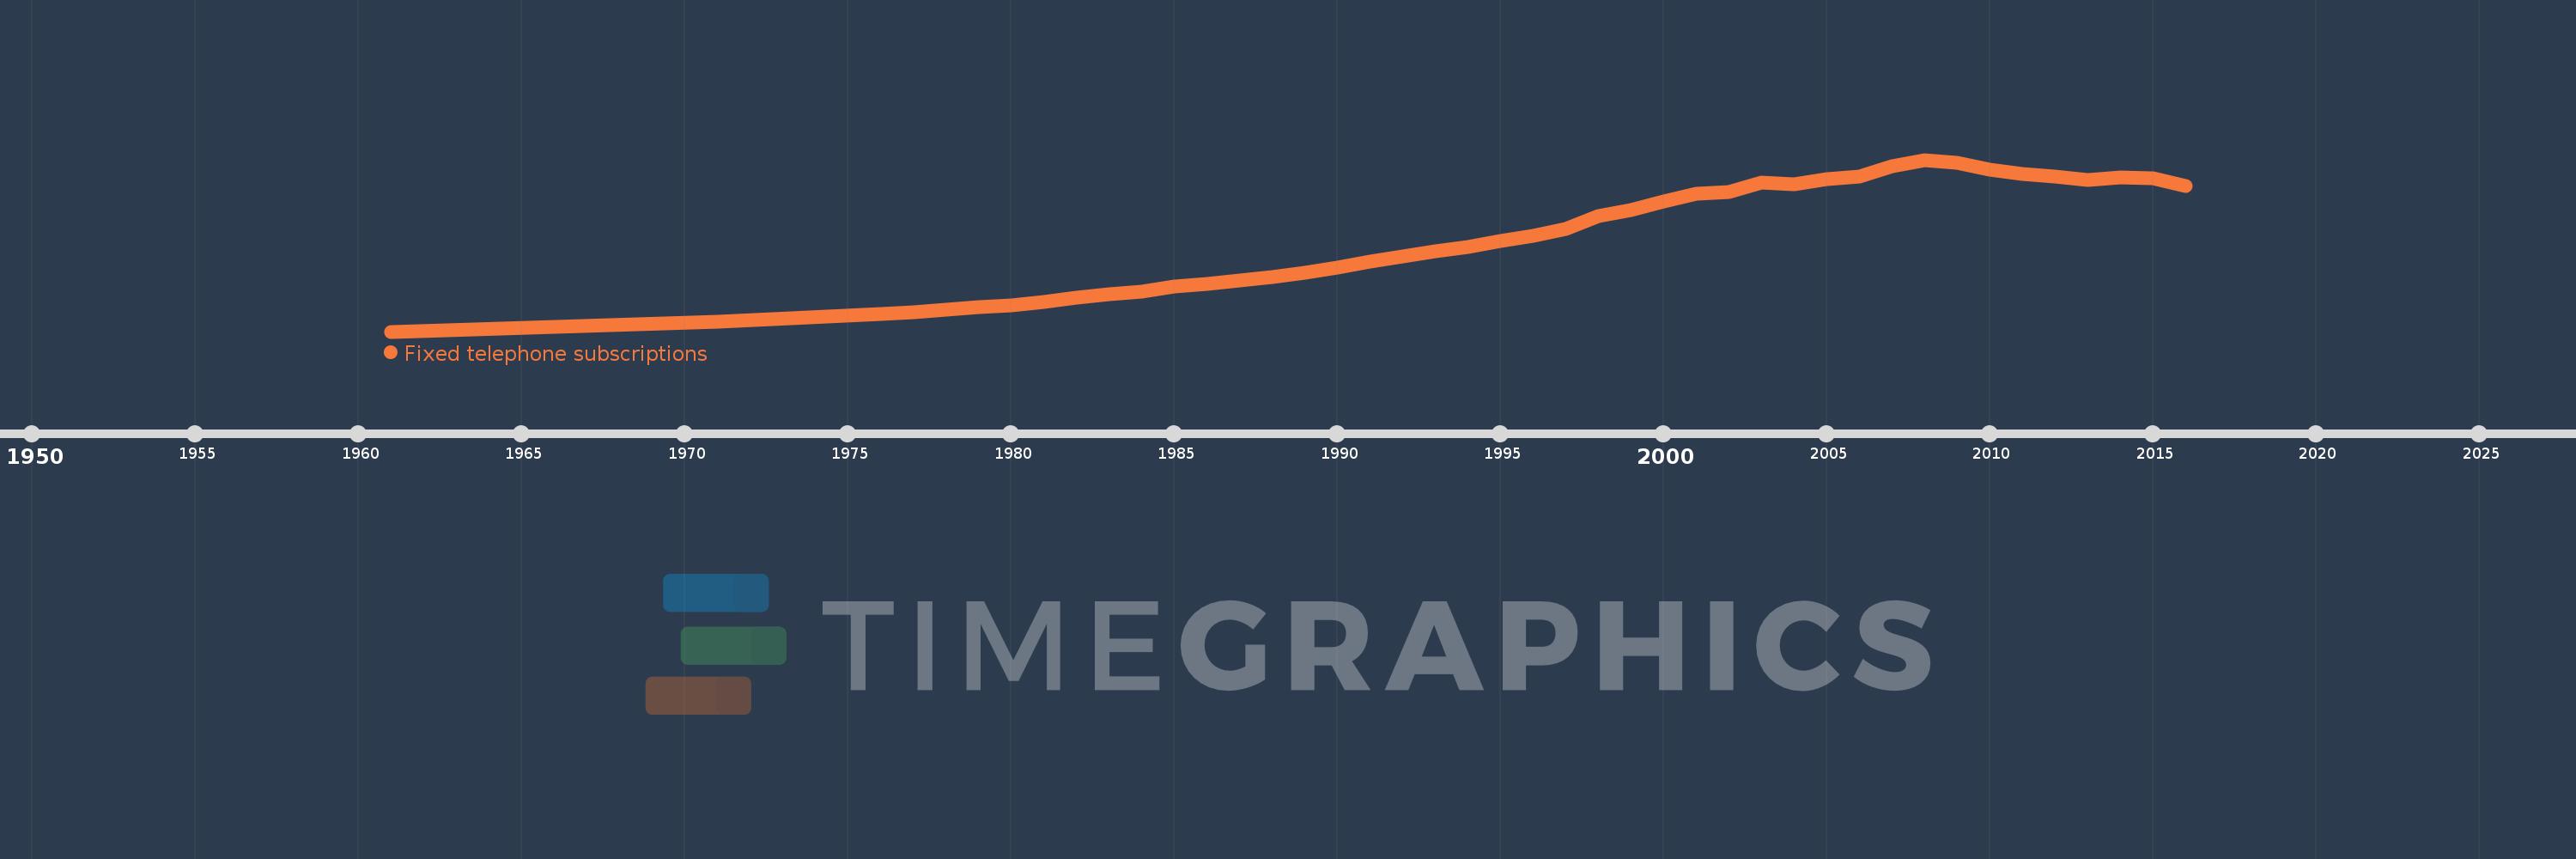
Fixed telephone subscriptions
2016,2015,2014,2013,2012,2011,2010,2009,2008,2007,2006,2005,2004,2003,2002,2001,2000,1999,1998,1997,1996,1995,1994,1993,1992,1991,1990,1989,1988,1987,1986,1985,1984,1983,1982,1981,1980,1979,1978,1977,1976,1971,1966,1961
This statistics in other country:
AfghanistanAlbaniaAlgeriaAmerican SamoaAndorraAngolaAntigua and BarbudaArab WorldArgentinaArmeniaArubaAustraliaAustriaAzerbaijanBahamas, TheBahrainBangladeshBarbadosBelarusBelgiumBelizeBeninBermudaBhutanBoliviaBosnia and HerzegovinaBotswanaBrazilBritish Virgin IslandsBrunei DarussalamBulgariaBurkina FasoBurundiCabo VerdeCambodiaCameroonCanadaCaribbean small statesCayman IslandsCentral African RepublicCentral Europe and the BalticsChadChileChinaColombiaComorosCongo, Dem. Rep.Congo, Rep.Costa RicaCote d'IvoireCroatiaCubaCuracaoCyprusCzech RepublicDenmarkDjiboutiDominicaDominican RepublicEarly-demographic dividendEast Asia & PacificEast Asia & Pacific (excluding high income)East Asia & Pacific (IDA & IBRD countries)EcuadorEgypt, Arab Rep.El SalvadorEquatorial GuineaEritreaEstoniaEthiopiaEuro areaEurope & Central AsiaEurope & Central Asia (excluding high income)Europe & Central Asia (IDA & IBRD countries)European UnionFaroe IslandsFijiFinlandFragile and conflict affected situationsFranceFrench PolynesiaGabonGambia, TheGeorgiaGermanyGhanaGibraltarGreeceGreenlandGrenadaGuamGuatemalaGuineaGuinea-BissauGuyanaHaitiHeavily indebted poor countries (HIPC)High incomeHondurasHong Kong SAR, ChinaHungaryIBRD onlyIcelandIDA & IBRD totalIDA blendIDA onlyIDA totalIndiaIndonesiaIran, Islamic Rep.IraqIrelandIsraelItalyJamaicaJapanJordanKazakhstanKenyaKiribatiKorea, Dem. People’s Rep.Korea, Rep.KosovoKuwaitKyrgyz RepublicLao PDRLate-demographic dividendLatin America & Caribbean Latin America & Caribbean (excluding high income)Latin America & the Caribbean (IDA & IBRD countries)LatviaLeast developed countries: UN classificationLebanonLesothoLiberiaLibyaLiechtensteinLithuaniaLow & middle incomeLow incomeLower middle incomeLuxembourgMacao SAR, ChinaMacedonia, FYRMadagascarMalawiMalaysiaMaldivesMaliMaltaMarshall IslandsMauritaniaMauritiusMexicoMicronesia, Fed. Sts.Middle East & North AfricaMiddle East & North Africa (excluding high income)Middle East & North Africa (IDA & IBRD countries)Middle incomeMoldovaMonacoMongoliaMontenegroMoroccoMozambiqueMyanmarNamibiaNauruNepalNetherlandsNew CaledoniaNew ZealandNicaraguaNigerNigeriaNorth AmericaNorthern Mariana IslandsNorwayOECD membersOmanOther small statesPacific island small statesPakistanPalauPanamaPapua New GuineaParaguayPeruPhilippinesPolandPortugalPost-demographic dividendPre-demographic dividendPuerto RicoQatarRomaniaRussian FederationRwandaSamoaSan MarinoSao Tome and PrincipeSaudi ArabiaSenegalSerbiaSeychellesSierra LeoneSingaporeSlovak RepublicSloveniaSmall statesSolomon IslandsSomaliaSouth AfricaSouth AsiaSouth Asia (IDA & IBRD)South SudanSpainSri LankaSt. Kitts and NevisSt. LuciaSt. Vincent and the GrenadinesSub-Saharan Africa Sub-Saharan Africa (excluding high income)Sub-Saharan Africa (IDA & IBRD countries)SudanSurinameSwazilandSwedenSwitzerlandSyrian Arab RepublicTajikistanTanzaniaThailandTimor-LesteTogoTongaTrinidad and TobagoTunisiaTurkeyTurkmenistanTurks and Caicos IslandsTuvaluUgandaUkraineUnited Arab EmiratesUnited KingdomUnited StatesUpper middle incomeUruguayUzbekistanVanuatuVenezuela, RBVietnamVirgin Islands (U.S.)West Bank and GazaWorldYemen, Rep.ZambiaZimbabwe Timeline:
This timeline shows a graph from 1961 to 2016 of Ireland. No data until 1960. Number of actual observations by date: 44.
Source name:
World Development Indicators
Source organization:
International Telecommunication Union, World Telecommunication/ICT Development Report and database, and World Bank estimates.
Categories, topics:
Infrastructure
Last updated:
apr 23, 2017
Indicators value changes by year
Minimum:
110.625K
jan 1, 1961
Maximum:
2.259 mln
jan 1, 2008
At the date of observation
Value
Absolute change
Change from previous value
jan 1, 1961
110.625K
+110.625K
0.0%
jan 1, 1966
165.0K
+54.375K
49.15%
jan 1, 1971
234.0K
+69.0K
41.82%
jan 1, 1976
330.0K
+96.0K
41.03%
jan 1, 1977
357.0K
+27.0K
8.18%
jan 1, 1978
386.0K
+29.0K
8.12%
jan 1, 1979
412.0K
+26.0K
6.74%
jan 1, 1980
436.0K
+24.0K
5.83%
jan 1, 1981
483.0K
+47.0K
10.78%
jan 1, 1982
536.0K
+53.0K
10.97%
jan 1, 1983
579.6K
+43.6K
8.13%
jan 1, 1984
613.459K
+33.859K
5.84%
jan 1, 1985
669.267K
+55.808K
9.1%
jan 1, 1986
703.0K
+33.733K
5.04%
jan 1, 1987
750.805K
+47.805K
6.8%
jan 1, 1988
796.204K
+45.399K
6.05%
jan 1, 1989
842.677K
+46.473K
5.84%
jan 1, 1990
916.0K
+73.323K
8.7%
jan 1, 1991
983.0K
+67.0K
7.31%
jan 1, 1992
1.048 mln
+65.0K
6.61%
jan 1, 1993
1.113 mln
+65.0K
6.2%
jan 1, 1994
1.17 mln
+57.0K
5.12%
jan 1, 1995
1.24 mln
+70.0K
5.98%
jan 1, 1996
1.31 mln
+70.0K
5.65%
jan 1, 1997
1.39 mln
+80.0K
6.11%
jan 1, 1998
1.558 mln
+168.0K
12.09%
jan 1, 1999
1.633 mln
+75.0K
4.81%
jan 1, 2000
1.737 mln
+104.0K
6.37%
jan 1, 2001
1.832 mln
+95.0K
5.47%
jan 1, 2002
1.86 mln
+28.0K
1.53%
jan 1, 2003
1.975 mln
+115.0K
6.18%
jan 1, 2004
1.955 mln
-20.0K
-1.01%
jan 1, 2005
2.015 mln
+60.0K
3.07%
jan 1, 2006
2.052 mln
+37.0K
1.84%
jan 1, 2007
2.177 mln
+124.646K
6.07%
jan 1, 2008
2.259 mln
+81.98K
3.77%
jan 1, 2009
2.223 mln
-35.975K
-1.59%
jan 1, 2010
2.132 mln
-90.75K
-4.08%
jan 1, 2011
2.078 mln
-53.923K
-2.53%
jan 1, 2012
2.047 mln
-31.411K
-1.51%
jan 1, 2013
2.008 mln
-38.821K
-1.9%
jan 1, 2014
2.034 mln
+26.727K
1.33%
jan 1, 2015
2.023 mln
-11.951K
-0.59%
jan 1, 2016
1.932 mln
-90.463K
-4.47%
Ranking of countries by current statistics by years


Comments: