29
/
en
AIzaSyAYiBZKx7MnpbEhh9jyipgxe19OcubqV5w
April 1, 2024
231019
Rwanda
RWA
true
2
1
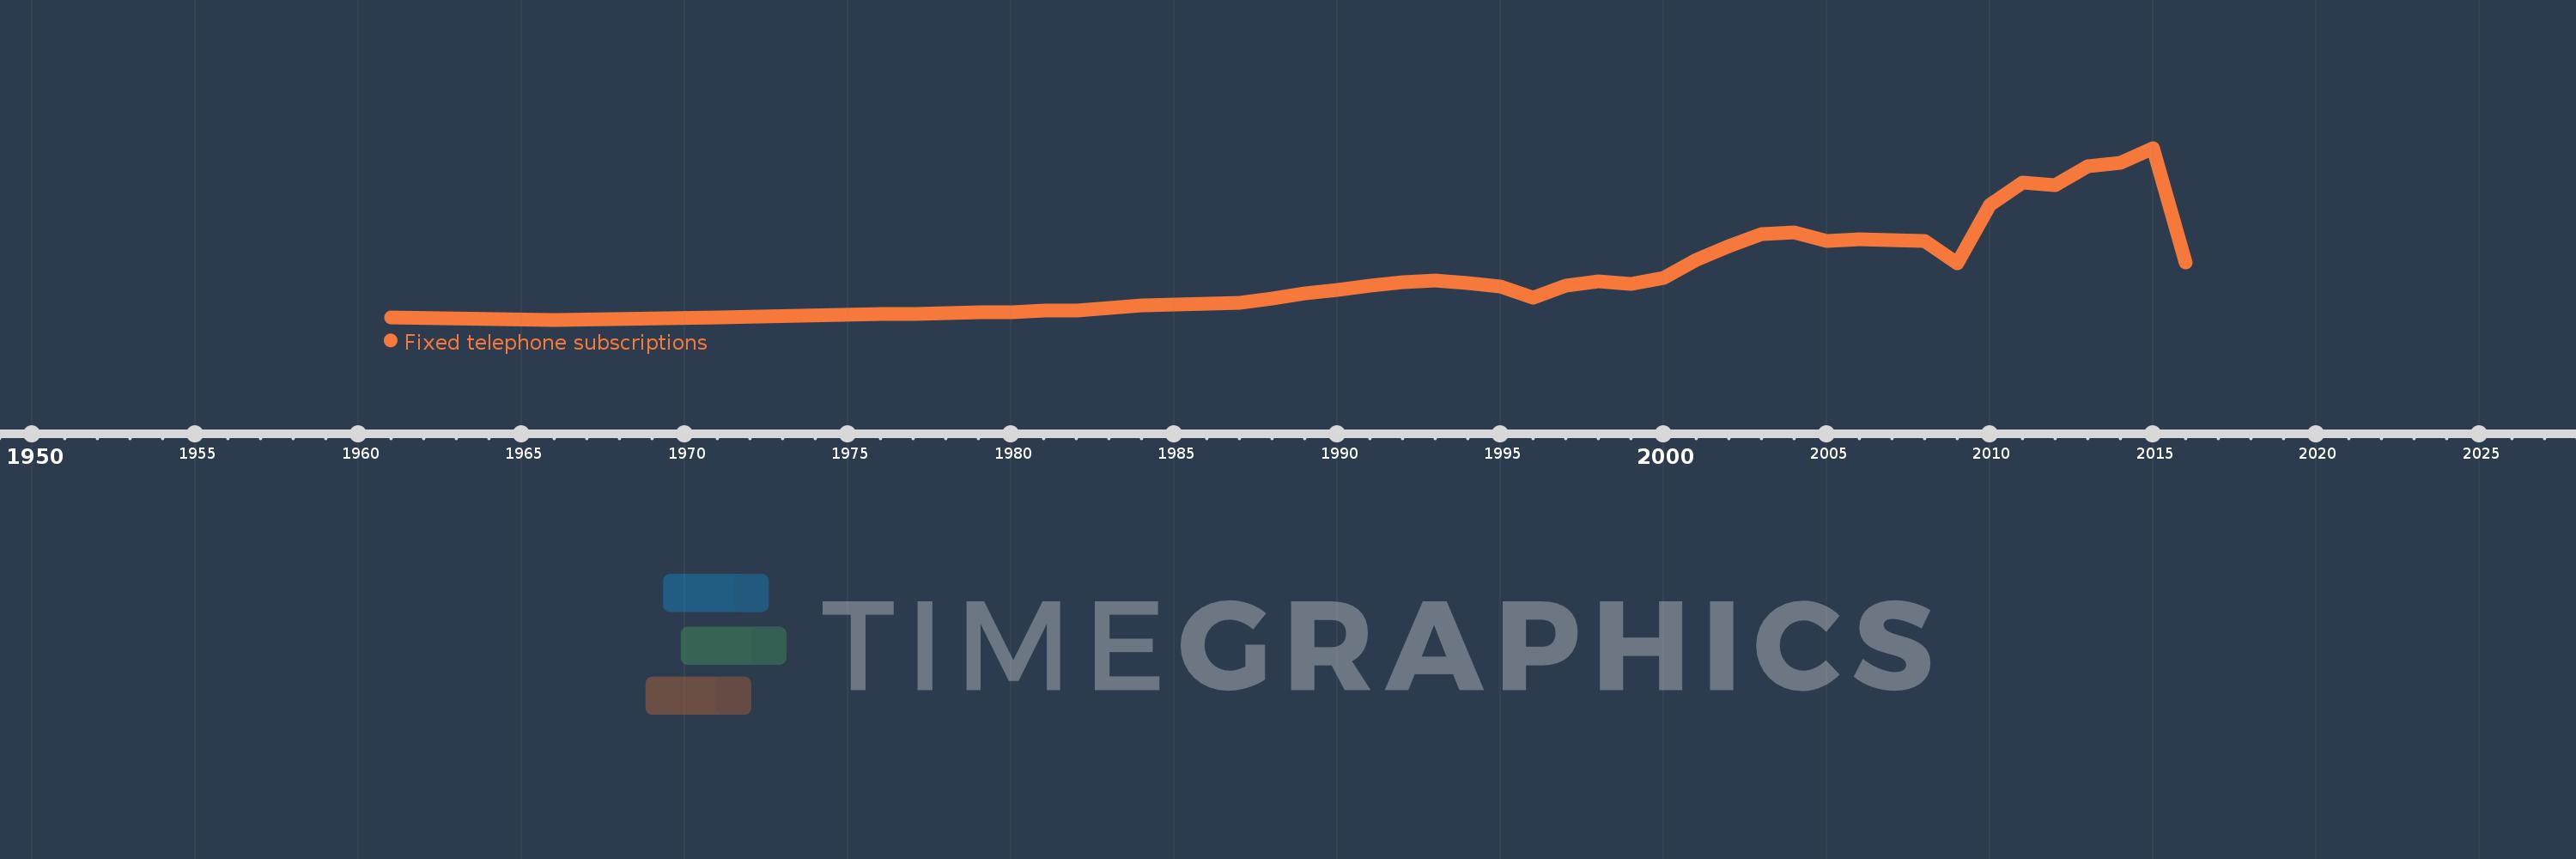
Fixed telephone subscriptions
2016,2015,2014,2013,2012,2011,2010,2009,2008,2007,2006,2005,2004,2003,2002,2001,2000,1999,1998,1997,1996,1995,1994,1993,1992,1991,1990,1989,1988,1987,1986,1985,1984,1983,1982,1981,1980,1979,1978,1977,1976,1971,1966,1961
This statistics in other country:
AfghanistanAlbaniaAlgeriaAmerican SamoaAndorraAngolaAntigua and BarbudaArab WorldArgentinaArmeniaArubaAustraliaAustriaAzerbaijanBahamas, TheBahrainBangladeshBarbadosBelarusBelgiumBelizeBeninBermudaBhutanBoliviaBosnia and HerzegovinaBotswanaBrazilBritish Virgin IslandsBrunei DarussalamBulgariaBurkina FasoBurundiCabo VerdeCambodiaCameroonCanadaCaribbean small statesCayman IslandsCentral African RepublicCentral Europe and the BalticsChadChileChinaColombiaComorosCongo, Dem. Rep.Congo, Rep.Costa RicaCote d'IvoireCroatiaCubaCuracaoCyprusCzech RepublicDenmarkDjiboutiDominicaDominican RepublicEarly-demographic dividendEast Asia & PacificEast Asia & Pacific (excluding high income)East Asia & Pacific (IDA & IBRD countries)EcuadorEgypt, Arab Rep.El SalvadorEquatorial GuineaEritreaEstoniaEthiopiaEuro areaEurope & Central AsiaEurope & Central Asia (excluding high income)Europe & Central Asia (IDA & IBRD countries)European UnionFaroe IslandsFijiFinlandFragile and conflict affected situationsFranceFrench PolynesiaGabonGambia, TheGeorgiaGermanyGhanaGibraltarGreeceGreenlandGrenadaGuamGuatemalaGuineaGuinea-BissauGuyanaHaitiHeavily indebted poor countries (HIPC)High incomeHondurasHong Kong SAR, ChinaHungaryIBRD onlyIcelandIDA & IBRD totalIDA blendIDA onlyIDA totalIndiaIndonesiaIran, Islamic Rep.IraqIrelandIsraelItalyJamaicaJapanJordanKazakhstanKenyaKiribatiKorea, Dem. People’s Rep.Korea, Rep.KosovoKuwaitKyrgyz RepublicLao PDRLate-demographic dividendLatin America & Caribbean Latin America & Caribbean (excluding high income)Latin America & the Caribbean (IDA & IBRD countries)LatviaLeast developed countries: UN classificationLebanonLesothoLiberiaLibyaLiechtensteinLithuaniaLow & middle incomeLow incomeLower middle incomeLuxembourgMacao SAR, ChinaMacedonia, FYRMadagascarMalawiMalaysiaMaldivesMaliMaltaMarshall IslandsMauritaniaMauritiusMexicoMicronesia, Fed. Sts.Middle East & North AfricaMiddle East & North Africa (excluding high income)Middle East & North Africa (IDA & IBRD countries)Middle incomeMoldovaMonacoMongoliaMontenegroMoroccoMozambiqueMyanmarNamibiaNauruNepalNetherlandsNew CaledoniaNew ZealandNicaraguaNigerNigeriaNorth AmericaNorthern Mariana IslandsNorwayOECD membersOmanOther small statesPacific island small statesPakistanPalauPanamaPapua New GuineaParaguayPeruPhilippinesPolandPortugalPost-demographic dividendPre-demographic dividendPuerto RicoQatarRomaniaRussian FederationRwandaSamoaSan MarinoSao Tome and PrincipeSaudi ArabiaSenegalSerbiaSeychellesSierra LeoneSingaporeSlovak RepublicSloveniaSmall statesSolomon IslandsSomaliaSouth AfricaSouth AsiaSouth Asia (IDA & IBRD)South SudanSpainSri LankaSt. Kitts and NevisSt. LuciaSt. Vincent and the GrenadinesSub-Saharan Africa Sub-Saharan Africa (excluding high income)Sub-Saharan Africa (IDA & IBRD countries)SudanSurinameSwazilandSwedenSwitzerlandSyrian Arab RepublicTajikistanTanzaniaThailandTimor-LesteTogoTongaTrinidad and TobagoTunisiaTurkeyTurkmenistanTurks and Caicos IslandsTuvaluUgandaUkraineUnited Arab EmiratesUnited KingdomUnited StatesUpper middle incomeUruguayUzbekistanVanuatuVenezuela, RBVietnamVirgin Islands (U.S.)West Bank and GazaWorldYemen, Rep.ZambiaZimbabwe Timeline:
This timeline shows a graph from 1961 to 2016 of Rwanda. No data until 1960. Number of actual observations by date: 44.
Source name:
World Development Indicators
Source organization:
International Telecommunication Union, World Telecommunication/ICT Development Report and database, and World Bank estimates.
Categories, topics:
Infrastructure
Last updated:
apr 23, 2017
Indicators value changes by year
Maximum:
49.612K
jan 1, 2015
At the date of observation
Value
Absolute change
Change from previous value
jan 1, 1961
1.366K
+1.366K
0.0%
jan 1, 1966
600.0
-766.0
-56.08%
jan 1, 1971
1.2K
+600.0
100.0%
jan 1, 1976
2.3K
+1.1K
91.67%
jan 1, 1978
2.5K
+200.0
8.7%
jan 1, 1979
2.7K
+200.0
8.0%
jan 1, 1980
2.8K
+100.0
3.7%
jan 1, 1981
3.3K
+500.0
17.86%
jan 1, 1982
3.34K
+40.0
1.21%
jan 1, 1983
4.034K
+694.0
20.78%
jan 1, 1984
4.666K
+632.0
15.67%
jan 1, 1985
4.905K
+239.0
5.12%
jan 1, 1986
5.168K
+263.0
5.36%
jan 1, 1987
5.444K
+276.0
5.34%
jan 1, 1988
6.561K
+1.117K
20.52%
jan 1, 1989
8.171K
+1.61K
24.54%
jan 1, 1990
9.213K
+1.042K
12.75%
jan 1, 1991
10.381K
+1.168K
12.68%
jan 1, 1992
11.298K
+917.0
8.83%
jan 1, 1993
11.763K
+465.0
4.12%
jan 1, 1994
11.0K
-763.0
-6.49%
jan 1, 1995
10.0K
-1000.0
-9.09%
jan 1, 1996
6.9K
-3.1K
-31.0%
jan 1, 1997
10.254K
+3.354K
48.61%
jan 1, 1998
11.621K
+1.367K
13.33%
jan 1, 1999
10.825K
-796.0
-6.85%
jan 1, 2000
12.651K
+1.826K
16.87%
jan 1, 2001
17.568K
+4.917K
38.87%
jan 1, 2002
21.5K
+3.932K
22.38%
jan 1, 2003
25.105K
+3.605K
16.77%
jan 1, 2004
25.565K
+460.0
1.83%
jan 1, 2005
22.972K
-2.593K
-10.14%
jan 1, 2006
23.601K
+629.0
2.74%
jan 1, 2007
23.362K
-239.0
-1.01%
jan 1, 2008
23.123K
-239.0
-1.02%
jan 1, 2009
16.77K
-6.353K
-27.47%
jan 1, 2010
33.451K
+16.681K
99.47%
jan 1, 2011
39.664K
+6.213K
18.57%
jan 1, 2012
38.901K
-763.0
-1.92%
jan 1, 2013
44.363K
+5.462K
14.04%
jan 1, 2014
45.338K
+975.0
2.2%
jan 1, 2015
49.612K
+4.274K
9.43%
jan 1, 2016
16.983K
-32.629K
-65.77%
Ranking of countries by current statistics by years


Comments: