29
/
en
AIzaSyAYiBZKx7MnpbEhh9jyipgxe19OcubqV5w
April 1, 2024
274744
United Arab Emirates
ARE
true
2
1
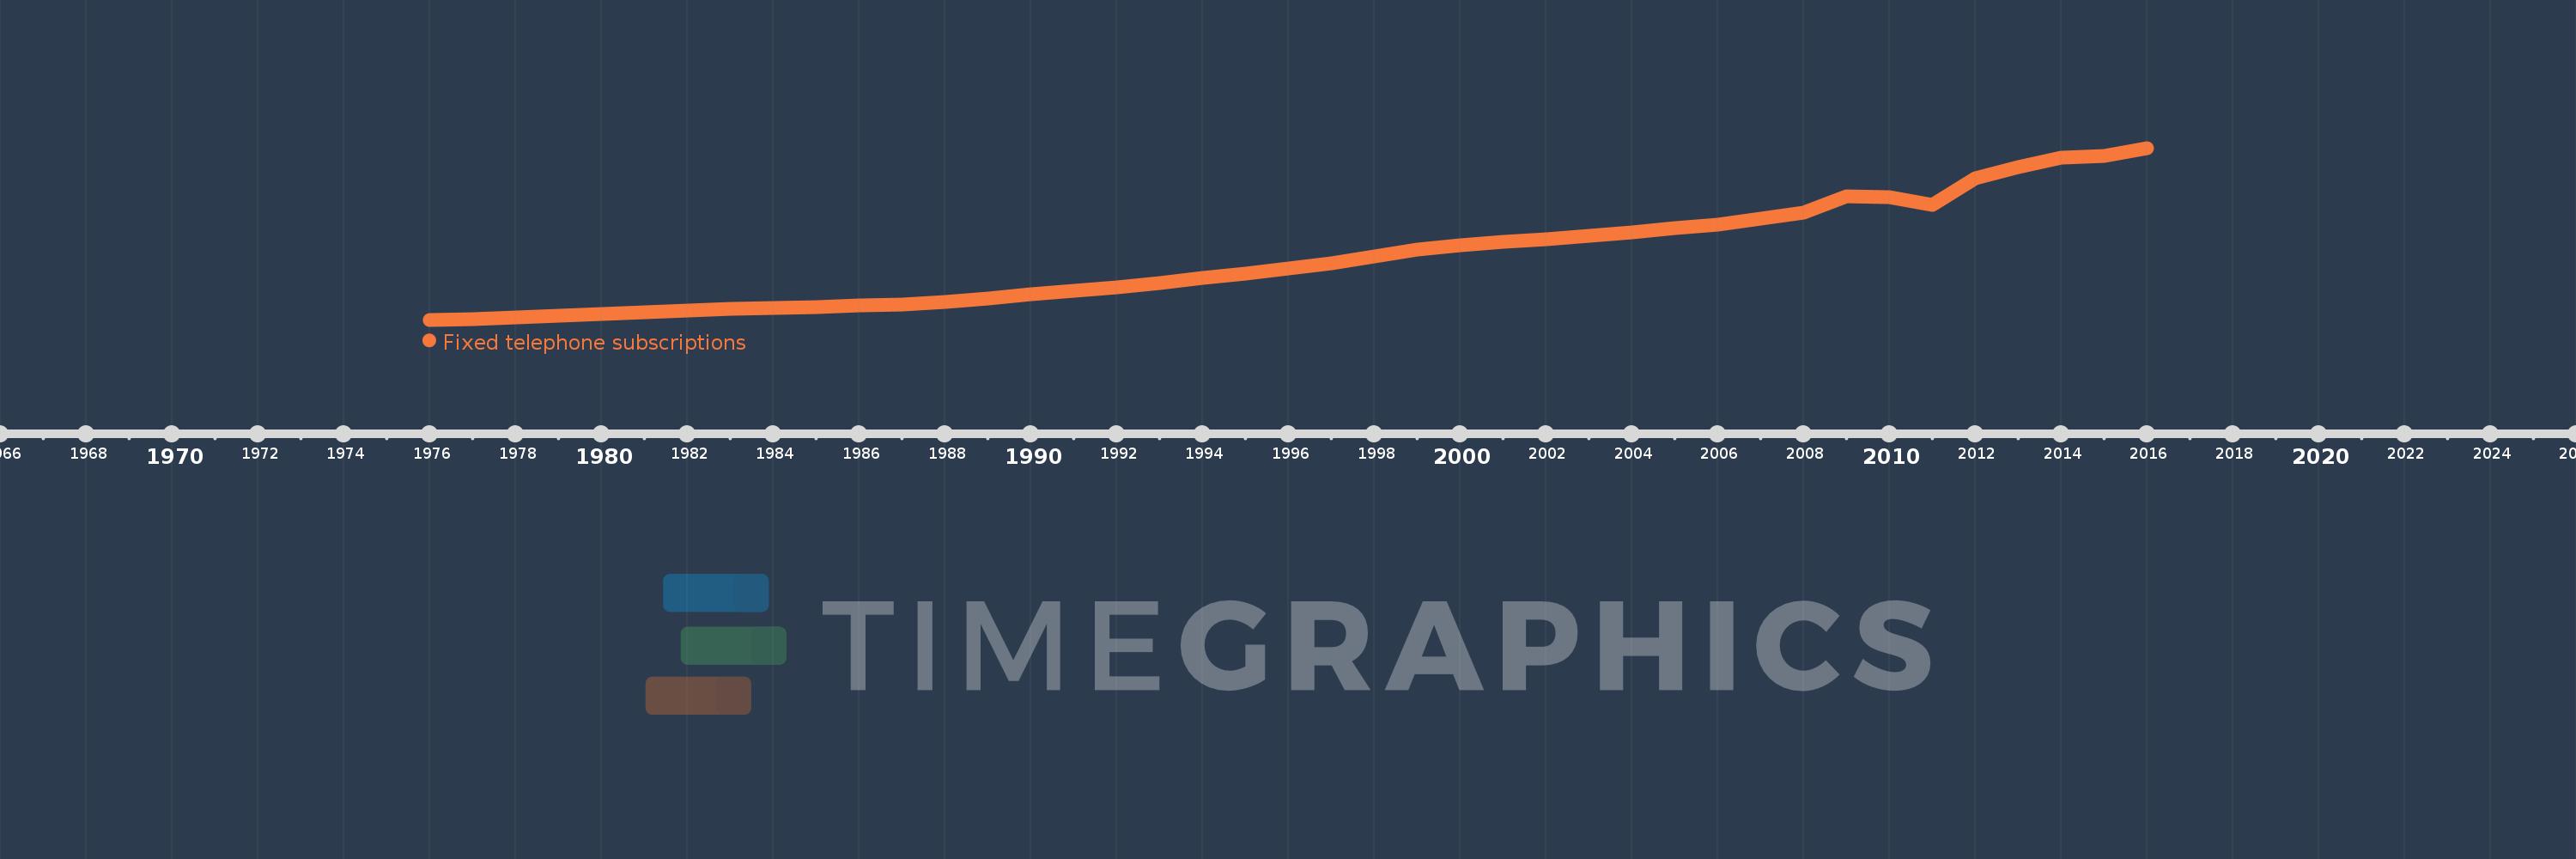
Fixed telephone subscriptions
2016,2015,2014,2013,2012,2011,2010,2009,2008,2007,2006,2005,2004,2003,2002,2001,2000,1999,1998,1997,1996,1995,1994,1993,1992,1991,1990,1989,1988,1987,1986,1985,1984,1983,1982,1981,1980,1979,1978,1977,1976
This statistics in other country:
AfghanistanAlbaniaAlgeriaAmerican SamoaAndorraAngolaAntigua and BarbudaArab WorldArgentinaArmeniaArubaAustraliaAustriaAzerbaijanBahamas, TheBahrainBangladeshBarbadosBelarusBelgiumBelizeBeninBermudaBhutanBoliviaBosnia and HerzegovinaBotswanaBrazilBritish Virgin IslandsBrunei DarussalamBulgariaBurkina FasoBurundiCabo VerdeCambodiaCameroonCanadaCaribbean small statesCayman IslandsCentral African RepublicCentral Europe and the BalticsChadChileChinaColombiaComorosCongo, Dem. Rep.Congo, Rep.Costa RicaCote d'IvoireCroatiaCubaCuracaoCyprusCzech RepublicDenmarkDjiboutiDominicaDominican RepublicEarly-demographic dividendEast Asia & PacificEast Asia & Pacific (excluding high income)East Asia & Pacific (IDA & IBRD countries)EcuadorEgypt, Arab Rep.El SalvadorEquatorial GuineaEritreaEstoniaEthiopiaEuro areaEurope & Central AsiaEurope & Central Asia (excluding high income)Europe & Central Asia (IDA & IBRD countries)European UnionFaroe IslandsFijiFinlandFragile and conflict affected situationsFranceFrench PolynesiaGabonGambia, TheGeorgiaGermanyGhanaGibraltarGreeceGreenlandGrenadaGuamGuatemalaGuineaGuinea-BissauGuyanaHaitiHeavily indebted poor countries (HIPC)High incomeHondurasHong Kong SAR, ChinaHungaryIBRD onlyIcelandIDA & IBRD totalIDA blendIDA onlyIDA totalIndiaIndonesiaIran, Islamic Rep.IraqIrelandIsraelItalyJamaicaJapanJordanKazakhstanKenyaKiribatiKorea, Dem. People’s Rep.Korea, Rep.KosovoKuwaitKyrgyz RepublicLao PDRLate-demographic dividendLatin America & Caribbean Latin America & Caribbean (excluding high income)Latin America & the Caribbean (IDA & IBRD countries)LatviaLeast developed countries: UN classificationLebanonLesothoLiberiaLibyaLiechtensteinLithuaniaLow & middle incomeLow incomeLower middle incomeLuxembourgMacao SAR, ChinaMacedonia, FYRMadagascarMalawiMalaysiaMaldivesMaliMaltaMarshall IslandsMauritaniaMauritiusMexicoMicronesia, Fed. Sts.Middle East & North AfricaMiddle East & North Africa (excluding high income)Middle East & North Africa (IDA & IBRD countries)Middle incomeMoldovaMonacoMongoliaMontenegroMoroccoMozambiqueMyanmarNamibiaNauruNepalNetherlandsNew CaledoniaNew ZealandNicaraguaNigerNigeriaNorth AmericaNorthern Mariana IslandsNorwayOECD membersOmanOther small statesPacific island small statesPakistanPalauPanamaPapua New GuineaParaguayPeruPhilippinesPolandPortugalPost-demographic dividendPre-demographic dividendPuerto RicoQatarRomaniaRussian FederationRwandaSamoaSan MarinoSao Tome and PrincipeSaudi ArabiaSenegalSerbiaSeychellesSierra LeoneSingaporeSlovak RepublicSloveniaSmall statesSolomon IslandsSomaliaSouth AfricaSouth AsiaSouth Asia (IDA & IBRD)South SudanSpainSri LankaSt. Kitts and NevisSt. LuciaSt. Vincent and the GrenadinesSub-Saharan Africa Sub-Saharan Africa (excluding high income)Sub-Saharan Africa (IDA & IBRD countries)SudanSurinameSwazilandSwedenSwitzerlandSyrian Arab RepublicTajikistanTanzaniaThailandTimor-LesteTogoTongaTrinidad and TobagoTunisiaTurkeyTurkmenistanTurks and Caicos IslandsTuvaluUgandaUkraineUnited Arab EmiratesUnited KingdomUnited StatesUpper middle incomeUruguayUzbekistanVanuatuVenezuela, RBVietnamVirgin Islands (U.S.)West Bank and GazaWorldYemen, Rep.ZambiaZimbabwe Timeline:
This timeline shows a graph from 1976 to 2016 of United Arab Emirates. No data until 1975. Number of actual observations by date: 41.
Source name:
World Development Indicators
Source organization:
International Telecommunication Union, World Telecommunication/ICT Development Report and database, and World Bank estimates.
Categories, topics:
Infrastructure
Last updated:
apr 23, 2017
Indicators value changes by year
Minimum:
25.808K
jan 1, 1976
Maximum:
2.208 mln
jan 1, 2016
At the date of observation
Value
Absolute change
Change from previous value
jan 1, 1976
25.808K
+25.808K
0.0%
jan 1, 1977
36.061K
+10.253K
39.73%
jan 1, 1978
49.83K
+13.769K
38.18%
jan 1, 1979
72.082K
+22.252K
44.66%
jan 1, 1980
96.386K
+24.304K
33.72%
jan 1, 1981
120.591K
+24.205K
25.11%
jan 1, 1982
142.591K
+22.0K
18.24%
jan 1, 1983
163.098K
+20.507K
14.38%
jan 1, 1984
177.841K
+14.743K
9.04%
jan 1, 1985
188.806K
+10.965K
6.17%
jan 1, 1986
207.052K
+18.246K
9.66%
jan 1, 1987
220.678K
+13.626K
6.58%
jan 1, 1988
247.8K
+27.122K
12.29%
jan 1, 1989
296.143K
+48.343K
19.51%
jan 1, 1990
352.73K
+56.587K
19.11%
jan 1, 1991
396.435K
+43.705K
12.39%
jan 1, 1992
437.503K
+41.068K
10.36%
jan 1, 1993
491.549K
+54.046K
12.35%
jan 1, 1994
553.206K
+61.657K
12.54%
jan 1, 1995
615.124K
+61.918K
11.19%
jan 1, 1996
672.33K
+57.206K
9.3%
jan 1, 1997
738.074K
+65.744K
9.78%
jan 1, 1998
835.09K
+97.016K
13.14%
jan 1, 1999
915.223K
+80.133K
9.6%
jan 1, 2000
975.178K
+59.955K
6.55%
jan 1, 2001
1.02 mln
+44.919K
4.61%
jan 1, 2002
1.053 mln
+32.833K
3.22%
jan 1, 2003
1.094 mln
+40.724K
3.87%
jan 1, 2004
1.136 mln
+42.104K
3.85%
jan 1, 2005
1.188 mln
+51.976K
4.58%
jan 1, 2006
1.237 mln
+49.126K
4.14%
jan 1, 2007
1.31 mln
+72.823K
5.89%
jan 1, 2008
1.386 mln
+75.84K
5.79%
jan 1, 2009
1.596 mln
+210.468K
15.19%
jan 1, 2010
1.58 mln
-15.843K
-0.99%
jan 1, 2011
1.479 mln
-100.663K
-6.37%
jan 1, 2012
1.825 mln
+346.011K
23.39%
jan 1, 2013
1.967 mln
+141.99K
7.78%
jan 1, 2014
2.086 mln
+118.529K
6.02%
jan 1, 2015
2.103 mln
+17.021K
0.82%
jan 1, 2016
2.208 mln
+105.389K
5.01%
Ranking of countries by current statistics by years


Comments: