30
/
AIzaSyAYiBZKx7MnpbEhh9jyipgxe19OcubqV5w
April 1, 2024
271142
Turks and Caicos Islands
TCA
true
2
1
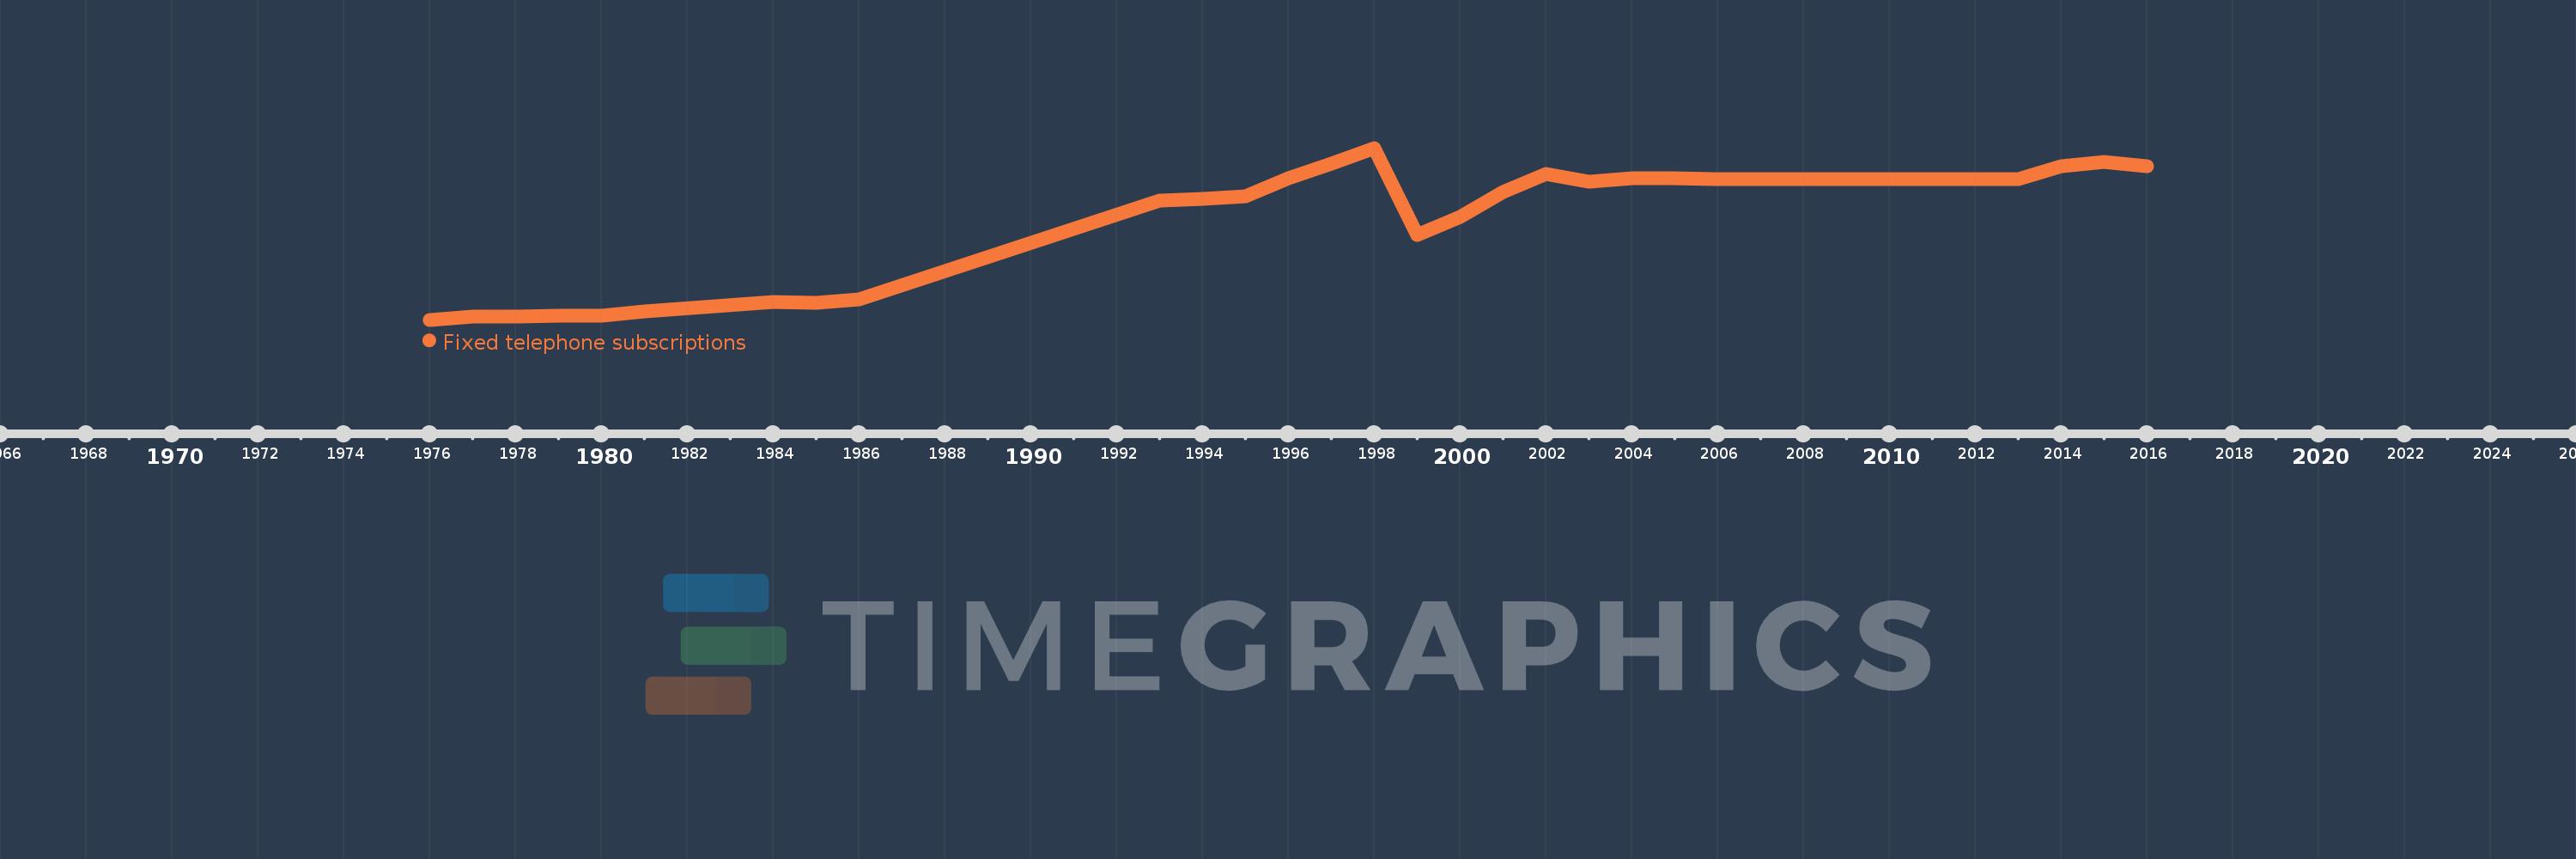
Fixed telephone subscriptions
2016,2015,2014,2013,2011,2010,2009,2008,2007,2006,2005,2004,2003,2002,2001,2000,1999,1998,1997,1996,1995,1994,1993,1986,1985,1984,1981,1980,1979,1978,1977,1976
