29
/
en
AIzaSyAYiBZKx7MnpbEhh9jyipgxe19OcubqV5w
April 1, 2024
37339
IDA & IBRD total
IBT
false
2
1
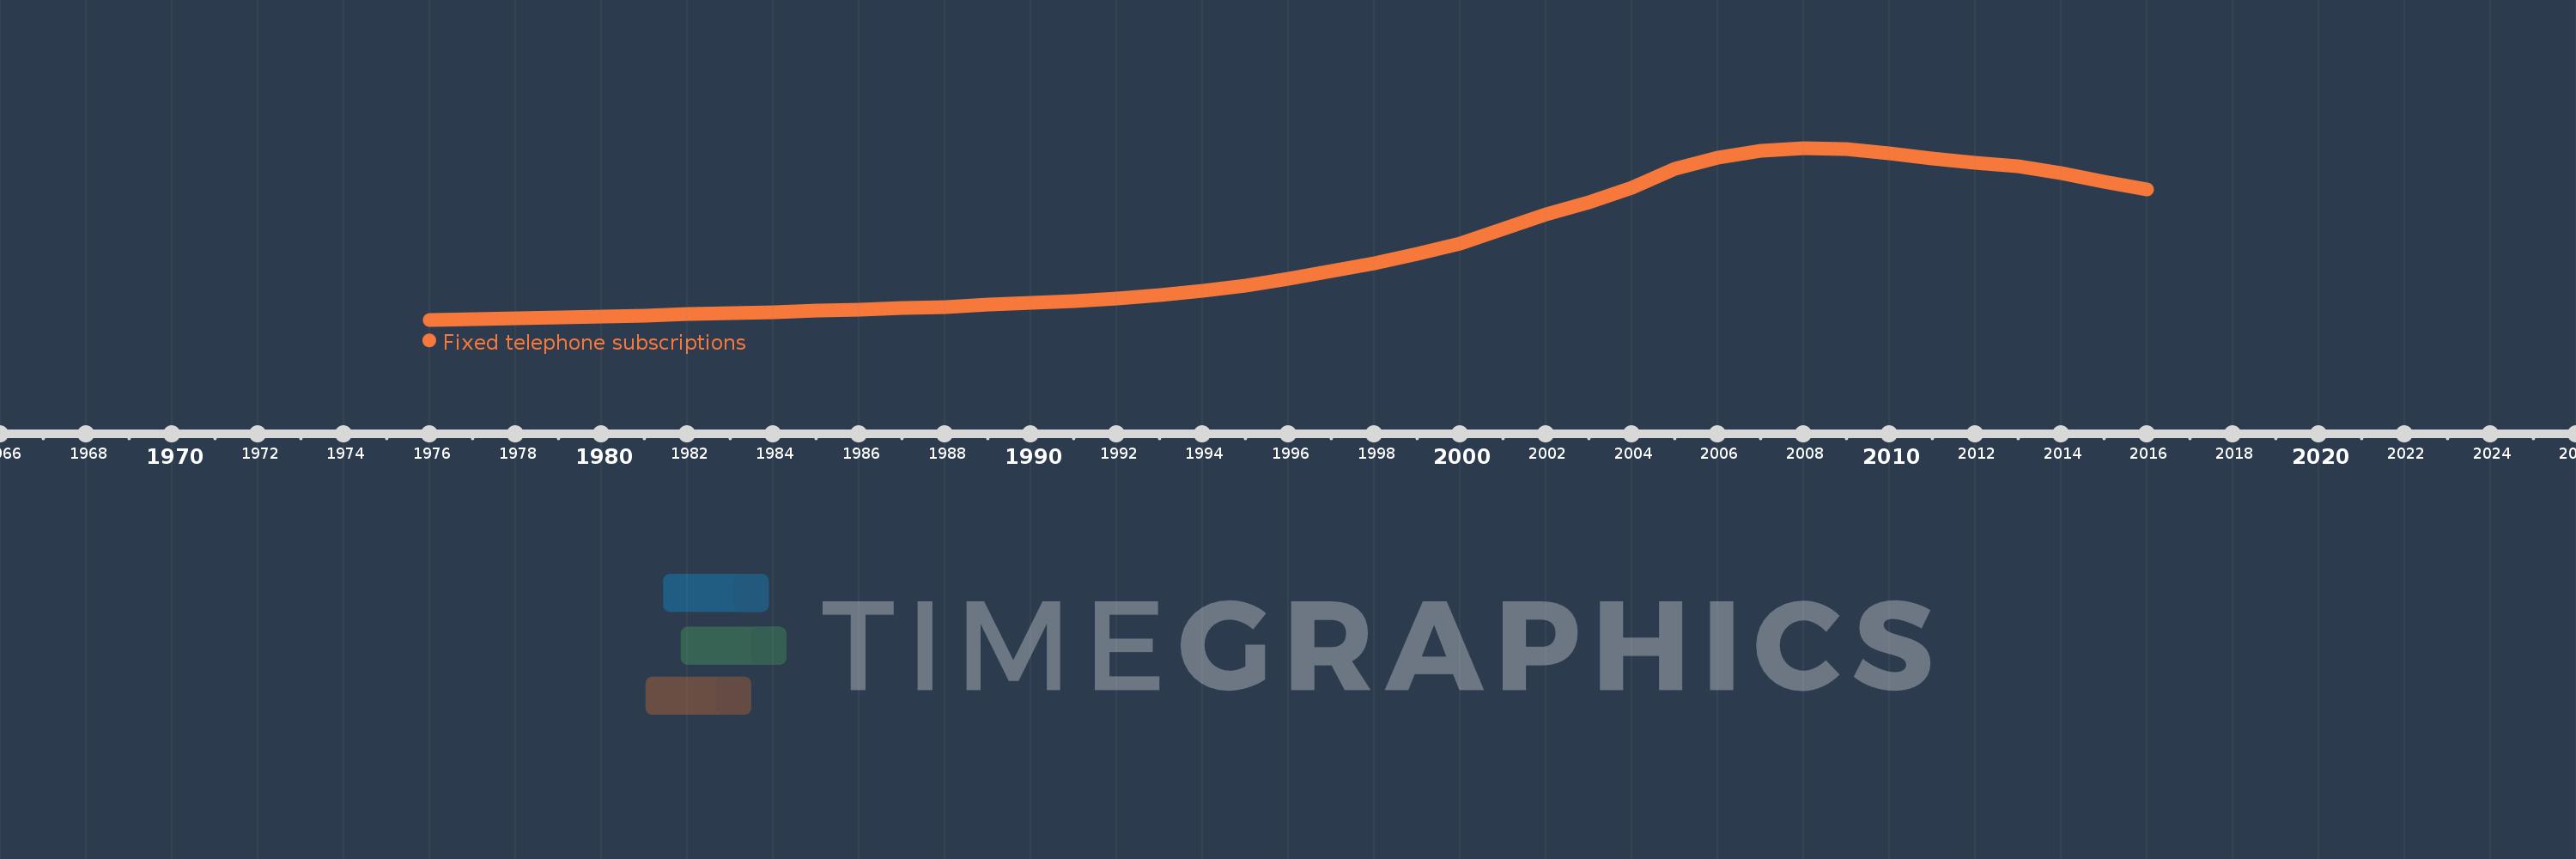
Fixed telephone subscriptions
2016,2015,2014,2013,2012,2011,2010,2009,2008,2007,2006,2005,2004,2003,2002,2001,2000,1999,1998,1997,1996,1995,1994,1993,1992,1991,1990,1989,1988,1987,1986,1985,1984,1983,1982,1981,1980,1979,1978,1977,1976
This statistics in other country:
AfghanistanAlbaniaAlgeriaAmerican SamoaAndorraAngolaAntigua and BarbudaArab WorldArgentinaArmeniaArubaAustraliaAustriaAzerbaijanBahamas, TheBahrainBangladeshBarbadosBelarusBelgiumBelizeBeninBermudaBhutanBoliviaBosnia and HerzegovinaBotswanaBrazilBritish Virgin IslandsBrunei DarussalamBulgariaBurkina FasoBurundiCabo VerdeCambodiaCameroonCanadaCaribbean small statesCayman IslandsCentral African RepublicCentral Europe and the BalticsChadChileChinaColombiaComorosCongo, Dem. Rep.Congo, Rep.Costa RicaCote d'IvoireCroatiaCubaCuracaoCyprusCzech RepublicDenmarkDjiboutiDominicaDominican RepublicEarly-demographic dividendEast Asia & PacificEast Asia & Pacific (excluding high income)East Asia & Pacific (IDA & IBRD countries)EcuadorEgypt, Arab Rep.El SalvadorEquatorial GuineaEritreaEstoniaEthiopiaEuro areaEurope & Central AsiaEurope & Central Asia (excluding high income)Europe & Central Asia (IDA & IBRD countries)European UnionFaroe IslandsFijiFinlandFragile and conflict affected situationsFranceFrench PolynesiaGabonGambia, TheGeorgiaGermanyGhanaGibraltarGreeceGreenlandGrenadaGuamGuatemalaGuineaGuinea-BissauGuyanaHaitiHeavily indebted poor countries (HIPC)High incomeHondurasHong Kong SAR, ChinaHungaryIBRD onlyIcelandIDA & IBRD totalIDA blendIDA onlyIDA totalIndiaIndonesiaIran, Islamic Rep.IraqIrelandIsraelItalyJamaicaJapanJordanKazakhstanKenyaKiribatiKorea, Dem. People’s Rep.Korea, Rep.KosovoKuwaitKyrgyz RepublicLao PDRLate-demographic dividendLatin America & Caribbean Latin America & Caribbean (excluding high income)Latin America & the Caribbean (IDA & IBRD countries)LatviaLeast developed countries: UN classificationLebanonLesothoLiberiaLibyaLiechtensteinLithuaniaLow & middle incomeLow incomeLower middle incomeLuxembourgMacao SAR, ChinaMacedonia, FYRMadagascarMalawiMalaysiaMaldivesMaliMaltaMarshall IslandsMauritaniaMauritiusMexicoMicronesia, Fed. Sts.Middle East & North AfricaMiddle East & North Africa (excluding high income)Middle East & North Africa (IDA & IBRD countries)Middle incomeMoldovaMonacoMongoliaMontenegroMoroccoMozambiqueMyanmarNamibiaNauruNepalNetherlandsNew CaledoniaNew ZealandNicaraguaNigerNigeriaNorth AmericaNorthern Mariana IslandsNorwayOECD membersOmanOther small statesPacific island small statesPakistanPalauPanamaPapua New GuineaParaguayPeruPhilippinesPolandPortugalPost-demographic dividendPre-demographic dividendPuerto RicoQatarRomaniaRussian FederationRwandaSamoaSan MarinoSao Tome and PrincipeSaudi ArabiaSenegalSerbiaSeychellesSierra LeoneSingaporeSlovak RepublicSloveniaSmall statesSolomon IslandsSomaliaSouth AfricaSouth AsiaSouth Asia (IDA & IBRD)South SudanSpainSri LankaSt. Kitts and NevisSt. LuciaSt. Vincent and the GrenadinesSub-Saharan Africa Sub-Saharan Africa (excluding high income)Sub-Saharan Africa (IDA & IBRD countries)SudanSurinameSwazilandSwedenSwitzerlandSyrian Arab RepublicTajikistanTanzaniaThailandTimor-LesteTogoTongaTrinidad and TobagoTunisiaTurkeyTurkmenistanTurks and Caicos IslandsTuvaluUgandaUkraineUnited Arab EmiratesUnited KingdomUnited StatesUpper middle incomeUruguayUzbekistanVanuatuVenezuela, RBVietnamVirgin Islands (U.S.)West Bank and GazaWorldYemen, Rep.ZambiaZimbabwe Timeline:
This timeline shows a graph from 1976 to 2016 of IDA & IBRD total. No data until 1975. Number of actual observations by date: 41.
Source name:
World Development Indicators
Source organization:
International Telecommunication Union, World Telecommunication/ICT Development Report and database, and World Bank estimates.
Categories, topics:
Infrastructure
Last updated:
apr 23, 2017
Indicators value changes by year
Minimum:
29.851 mln
jan 1, 1976
Maximum:
737.247 mln
jan 1, 2008
At the date of observation
Value
Absolute change
Change from previous value
jan 1, 1976
29.851 mln
+29.851 mln
0.0%
jan 1, 1977
32.682 mln
+2.831 mln
9.48%
jan 1, 1978
36.307 mln
+3.626 mln
11.09%
jan 1, 1979
39.703 mln
+3.396 mln
9.35%
jan 1, 1980
43.899 mln
+4.196 mln
10.57%
jan 1, 1981
47.306 mln
+3.407 mln
7.76%
jan 1, 1982
52.65 mln
+5.344 mln
11.3%
jan 1, 1983
57.074 mln
+4.424 mln
8.4%
jan 1, 1984
61.336 mln
+4.262 mln
7.47%
jan 1, 1985
66.178 mln
+4.842 mln
7.89%
jan 1, 1986
71.607 mln
+5.429 mln
8.2%
jan 1, 1987
77.307 mln
+5.699 mln
7.96%
jan 1, 1988
83.45 mln
+6.143 mln
7.95%
jan 1, 1989
91.011 mln
+7.561 mln
9.06%
jan 1, 1990
98.732 mln
+7.721 mln
8.48%
jan 1, 1991
107.615 mln
+8.883 mln
9.0%
jan 1, 1992
118.151 mln
+10.536 mln
9.79%
jan 1, 1993
131.142 mln
+12.991 mln
10.99%
jan 1, 1994
147.958 mln
+16.816 mln
12.82%
jan 1, 1995
170.86 mln
+22.902 mln
15.48%
jan 1, 1996
198.278 mln
+27.418 mln
16.05%
jan 1, 1997
229.467 mln
+31.189 mln
15.73%
jan 1, 1998
263.997 mln
+34.531 mln
15.05%
jan 1, 1999
300.029 mln
+36.031 mln
13.65%
jan 1, 2000
343.763 mln
+43.734 mln
14.58%
jan 1, 2001
403.363 mln
+59.6 mln
17.34%
jan 1, 2002
462.855 mln
+59.492 mln
14.75%
jan 1, 2003
513.423 mln
+50.568 mln
10.93%
jan 1, 2004
573.958 mln
+60.535 mln
11.79%
jan 1, 2005
649.852 mln
+75.894 mln
13.22%
jan 1, 2006
696.672 mln
+46.82 mln
7.2%
jan 1, 2007
724.732 mln
+28.06 mln
4.03%
jan 1, 2008
737.247 mln
+12.515 mln
1.73%
jan 1, 2009
732.465 mln
-4.782 mln
-0.65%
jan 1, 2010
713.425 mln
-19.04 mln
-2.6%
jan 1, 2011
693.941 mln
-19.484 mln
-2.73%
jan 1, 2012
675.446 mln
-18.495 mln
-2.67%
jan 1, 2013
662.946 mln
-12.5 mln
-1.85%
jan 1, 2014
634.023 mln
-28.923 mln
-4.36%
jan 1, 2015
597.592 mln
-36.431 mln
-5.75%
jan 1, 2016
567.732 mln
-29.86 mln
-5.0%
Ranking of countries by current statistics by years


Comments: