29
/
en
AIzaSyAYiBZKx7MnpbEhh9jyipgxe19OcubqV5w
April 1, 2024
212934
Nigeria
NGA
true
2
1
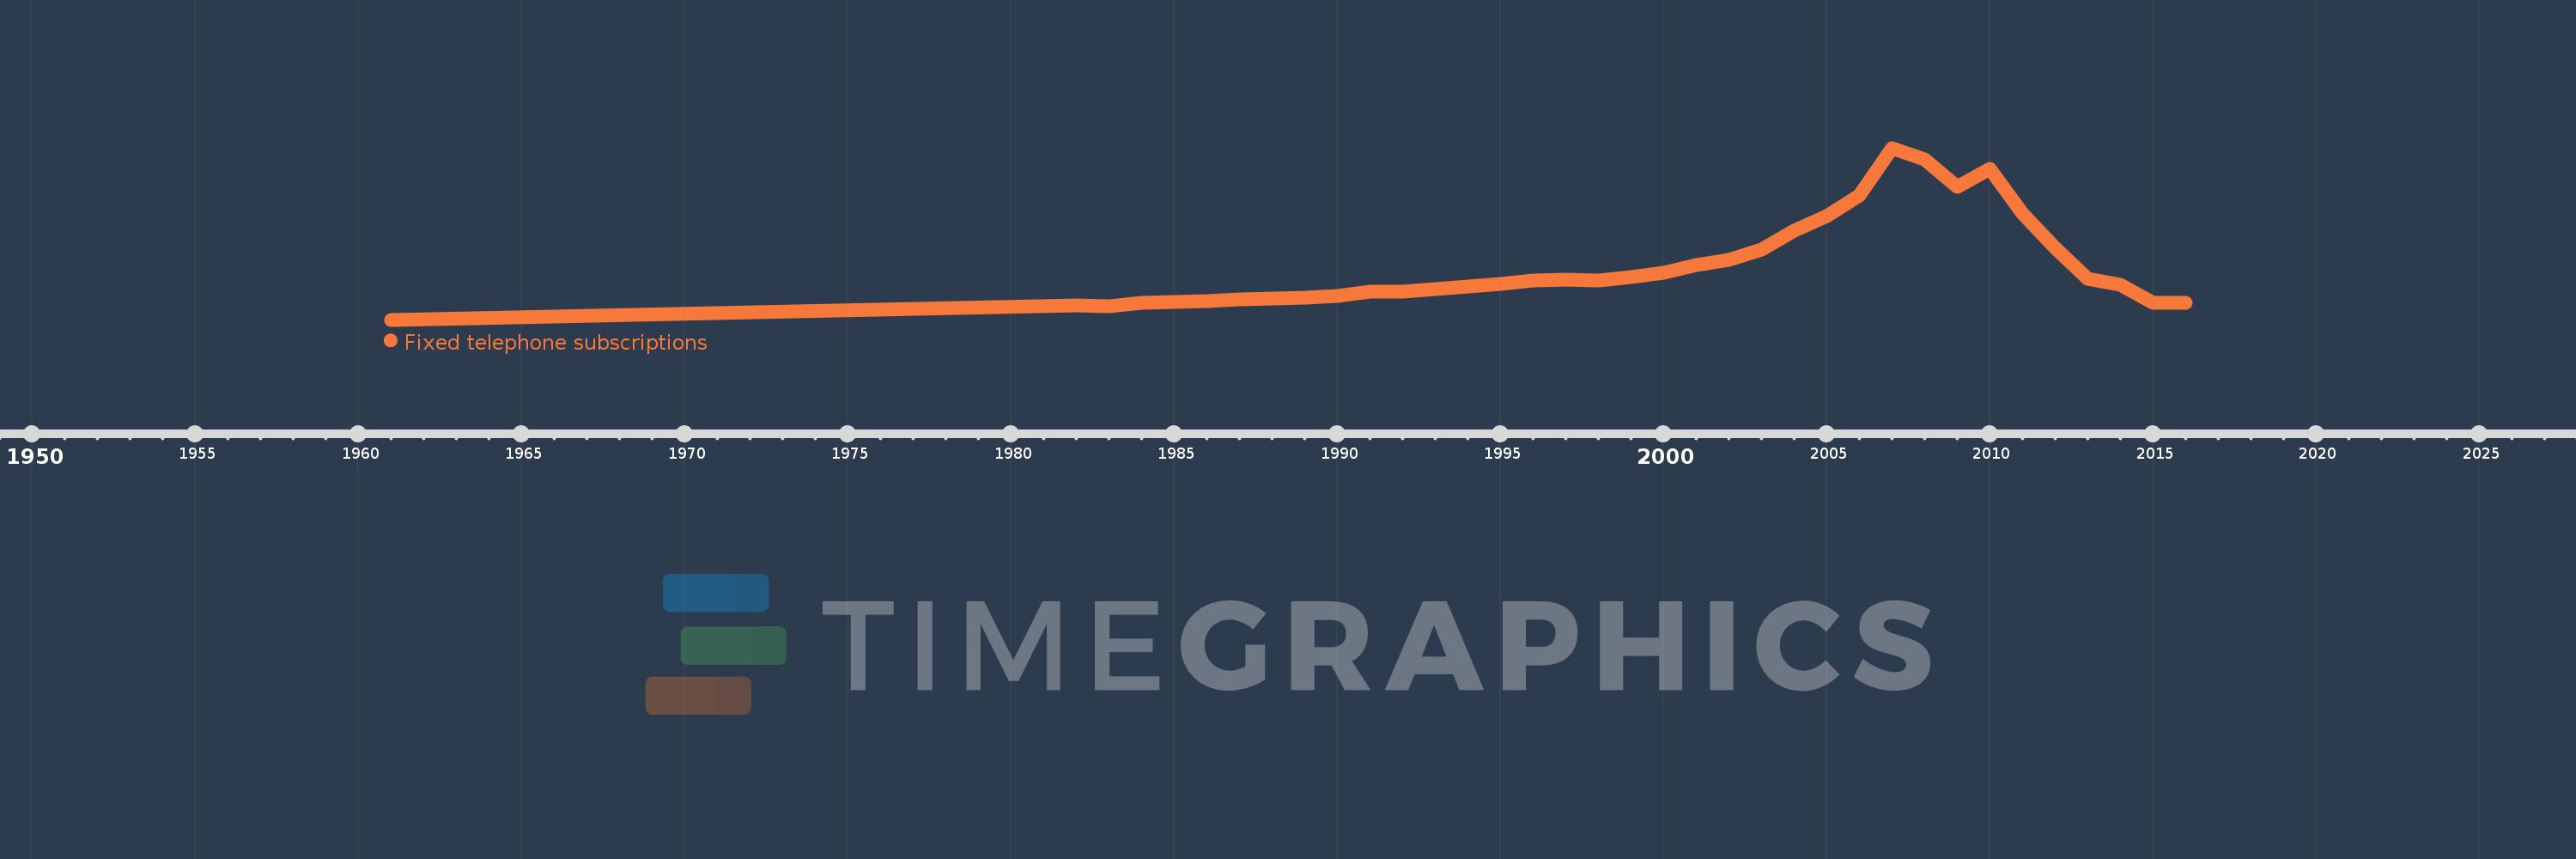
Fixed telephone subscriptions
2016,2015,2014,2013,2012,2011,2010,2009,2008,2007,2006,2005,2004,2003,2002,2001,2000,1999,1998,1997,1996,1995,1994,1993,1992,1991,1990,1989,1988,1987,1986,1985,1984,1983,1982,1961
This statistics in other country:
AfghanistanAlbaniaAlgeriaAmerican SamoaAndorraAngolaAntigua and BarbudaArab WorldArgentinaArmeniaArubaAustraliaAustriaAzerbaijanBahamas, TheBahrainBangladeshBarbadosBelarusBelgiumBelizeBeninBermudaBhutanBoliviaBosnia and HerzegovinaBotswanaBrazilBritish Virgin IslandsBrunei DarussalamBulgariaBurkina FasoBurundiCabo VerdeCambodiaCameroonCanadaCaribbean small statesCayman IslandsCentral African RepublicCentral Europe and the BalticsChadChileChinaColombiaComorosCongo, Dem. Rep.Congo, Rep.Costa RicaCote d'IvoireCroatiaCubaCuracaoCyprusCzech RepublicDenmarkDjiboutiDominicaDominican RepublicEarly-demographic dividendEast Asia & PacificEast Asia & Pacific (excluding high income)East Asia & Pacific (IDA & IBRD countries)EcuadorEgypt, Arab Rep.El SalvadorEquatorial GuineaEritreaEstoniaEthiopiaEuro areaEurope & Central AsiaEurope & Central Asia (excluding high income)Europe & Central Asia (IDA & IBRD countries)European UnionFaroe IslandsFijiFinlandFragile and conflict affected situationsFranceFrench PolynesiaGabonGambia, TheGeorgiaGermanyGhanaGibraltarGreeceGreenlandGrenadaGuamGuatemalaGuineaGuinea-BissauGuyanaHaitiHeavily indebted poor countries (HIPC)High incomeHondurasHong Kong SAR, ChinaHungaryIBRD onlyIcelandIDA & IBRD totalIDA blendIDA onlyIDA totalIndiaIndonesiaIran, Islamic Rep.IraqIrelandIsraelItalyJamaicaJapanJordanKazakhstanKenyaKiribatiKorea, Dem. People’s Rep.Korea, Rep.KosovoKuwaitKyrgyz RepublicLao PDRLate-demographic dividendLatin America & Caribbean Latin America & Caribbean (excluding high income)Latin America & the Caribbean (IDA & IBRD countries)LatviaLeast developed countries: UN classificationLebanonLesothoLiberiaLibyaLiechtensteinLithuaniaLow & middle incomeLow incomeLower middle incomeLuxembourgMacao SAR, ChinaMacedonia, FYRMadagascarMalawiMalaysiaMaldivesMaliMaltaMarshall IslandsMauritaniaMauritiusMexicoMicronesia, Fed. Sts.Middle East & North AfricaMiddle East & North Africa (excluding high income)Middle East & North Africa (IDA & IBRD countries)Middle incomeMoldovaMonacoMongoliaMontenegroMoroccoMozambiqueMyanmarNamibiaNauruNepalNetherlandsNew CaledoniaNew ZealandNicaraguaNigerNigeriaNorth AmericaNorthern Mariana IslandsNorwayOECD membersOmanOther small statesPacific island small statesPakistanPalauPanamaPapua New GuineaParaguayPeruPhilippinesPolandPortugalPost-demographic dividendPre-demographic dividendPuerto RicoQatarRomaniaRussian FederationRwandaSamoaSan MarinoSao Tome and PrincipeSaudi ArabiaSenegalSerbiaSeychellesSierra LeoneSingaporeSlovak RepublicSloveniaSmall statesSolomon IslandsSomaliaSouth AfricaSouth AsiaSouth Asia (IDA & IBRD)South SudanSpainSri LankaSt. Kitts and NevisSt. LuciaSt. Vincent and the GrenadinesSub-Saharan Africa Sub-Saharan Africa (excluding high income)Sub-Saharan Africa (IDA & IBRD countries)SudanSurinameSwazilandSwedenSwitzerlandSyrian Arab RepublicTajikistanTanzaniaThailandTimor-LesteTogoTongaTrinidad and TobagoTunisiaTurkeyTurkmenistanTurks and Caicos IslandsTuvaluUgandaUkraineUnited Arab EmiratesUnited KingdomUnited StatesUpper middle incomeUruguayUzbekistanVanuatuVenezuela, RBVietnamVirgin Islands (U.S.)West Bank and GazaWorldYemen, Rep.ZambiaZimbabwe Timeline:
This timeline shows a graph from 1961 to 2016 of Nigeria. No data until 1960. Number of actual observations by date: 36.
Source name:
World Development Indicators
Source organization:
International Telecommunication Union, World Telecommunication/ICT Development Report and database, and World Bank estimates.
Categories, topics:
Infrastructure
Last updated:
apr 23, 2017
Indicators value changes by year
Minimum:
20.544K
jan 1, 1961
Maximum:
1.688 mln
jan 1, 2007
At the date of observation
Value
Absolute change
Change from previous value
jan 1, 1961
20.544K
+20.544K
0.0%
jan 1, 1982
163.36K
+142.816K
695.17%
jan 1, 1983
151.6K
-11.76K
-7.2%
jan 1, 1984
182.55K
+30.95K
20.42%
jan 1, 1985
192.56K
+10.01K
5.48%
jan 1, 1986
203.98K
+11.42K
5.93%
jan 1, 1987
215.63K
+11.65K
5.71%
jan 1, 1988
227.46K
+11.83K
5.49%
jan 1, 1989
235.53K
+8.07K
3.55%
jan 1, 1990
250.0K
+14.47K
6.14%
jan 1, 1991
289.19K
+39.19K
15.68%
jan 1, 1992
294.166K
+4.976K
1.72%
jan 1, 1993
320.934K
+26.768K
9.1%
jan 1, 1994
342.287K
+21.353K
6.65%
jan 1, 1995
368.715K
+26.428K
7.72%
jan 1, 1996
405.073K
+36.358K
9.86%
jan 1, 1997
412.779K
+7.706K
1.9%
jan 1, 1998
404.177K
-8.602K
-2.08%
jan 1, 1999
438.619K
+34.442K
8.52%
jan 1, 2000
473.316K
+34.697K
7.91%
jan 1, 2001
553.374K
+80.058K
16.91%
jan 1, 2002
600.321K
+46.947K
8.48%
jan 1, 2003
702.0K
+101.679K
16.94%
jan 1, 2004
888.534K
+186.534K
26.57%
jan 1, 2005
1.028 mln
+138.985K
15.64%
jan 1, 2006
1.223 mln
+195.739K
19.05%
jan 1, 2007
1.688 mln
+464.714K
37.99%
jan 1, 2008
1.58 mln
-108.308K
-6.42%
jan 1, 2009
1.308 mln
-272.039K
-17.22%
jan 1, 2010
1.482 mln
+174.375K
13.34%
jan 1, 2011
1.05 mln
-431.763K
-29.13%
jan 1, 2012
719.406K
-330.831K
-31.5%
jan 1, 2013
418.166K
-301.24K
-41.87%
jan 1, 2014
360.537K
-57.629K
-13.78%
jan 1, 2015
183.29K
-177.247K
-49.16%
jan 1, 2016
187.155K
+3.865K
2.11%
Ranking of countries by current statistics by years


Comments: