29
/
en
AIzaSyAYiBZKx7MnpbEhh9jyipgxe19OcubqV5w
April 1, 2024
27266
East Asia & Pacific
EAS
false
2
1
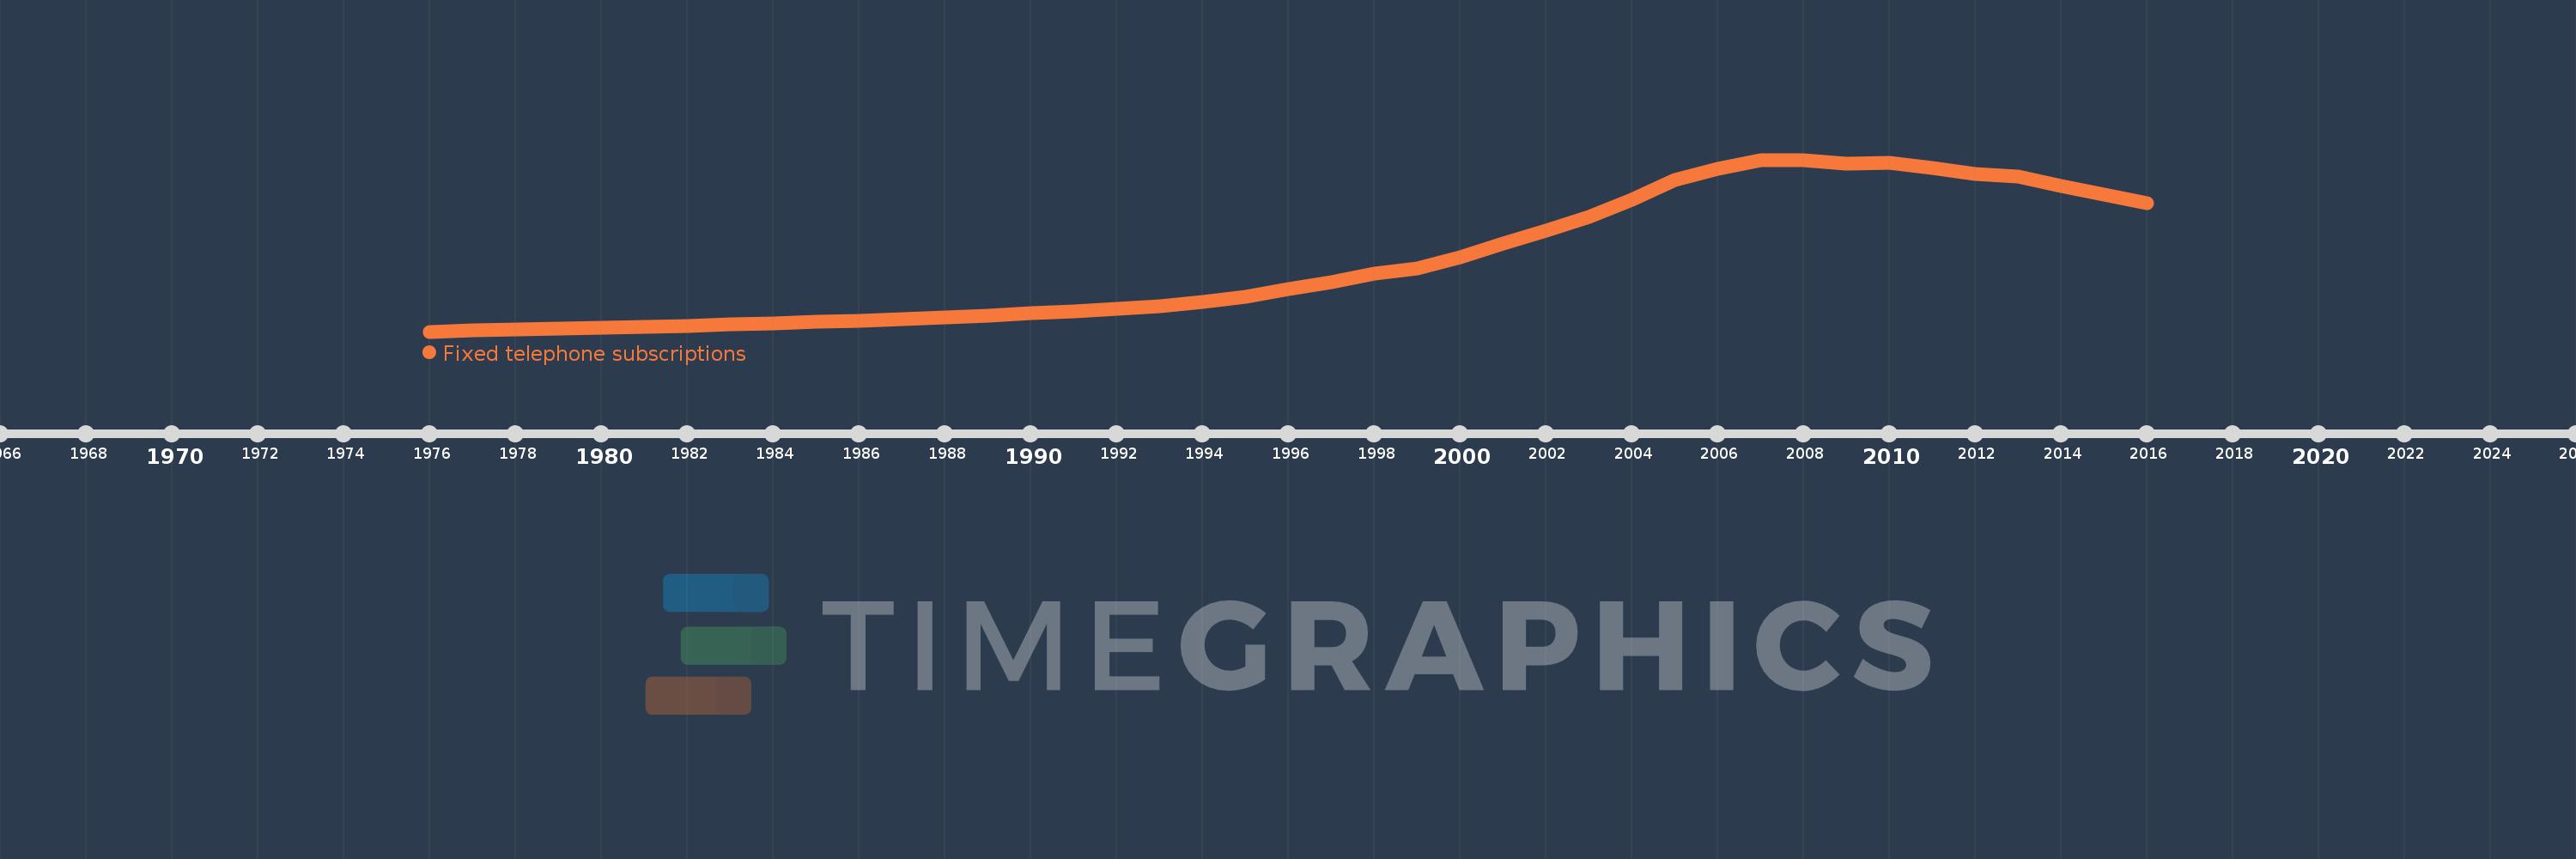
Fixed telephone subscriptions
2016,2015,2014,2013,2012,2011,2010,2009,2008,2007,2006,2005,2004,2003,2002,2001,2000,1999,1998,1997,1996,1995,1994,1993,1992,1991,1990,1989,1988,1987,1986,1985,1984,1983,1982,1981,1980,1979,1978,1977,1976
This statistics in other country:
AfghanistanAlbaniaAlgeriaAmerican SamoaAndorraAngolaAntigua and BarbudaArab WorldArgentinaArmeniaArubaAustraliaAustriaAzerbaijanBahamas, TheBahrainBangladeshBarbadosBelarusBelgiumBelizeBeninBermudaBhutanBoliviaBosnia and HerzegovinaBotswanaBrazilBritish Virgin IslandsBrunei DarussalamBulgariaBurkina FasoBurundiCabo VerdeCambodiaCameroonCanadaCaribbean small statesCayman IslandsCentral African RepublicCentral Europe and the BalticsChadChileChinaColombiaComorosCongo, Dem. Rep.Congo, Rep.Costa RicaCote d'IvoireCroatiaCubaCuracaoCyprusCzech RepublicDenmarkDjiboutiDominicaDominican RepublicEarly-demographic dividendEast Asia & PacificEast Asia & Pacific (excluding high income)East Asia & Pacific (IDA & IBRD countries)EcuadorEgypt, Arab Rep.El SalvadorEquatorial GuineaEritreaEstoniaEthiopiaEuro areaEurope & Central AsiaEurope & Central Asia (excluding high income)Europe & Central Asia (IDA & IBRD countries)European UnionFaroe IslandsFijiFinlandFragile and conflict affected situationsFranceFrench PolynesiaGabonGambia, TheGeorgiaGermanyGhanaGibraltarGreeceGreenlandGrenadaGuamGuatemalaGuineaGuinea-BissauGuyanaHaitiHeavily indebted poor countries (HIPC)High incomeHondurasHong Kong SAR, ChinaHungaryIBRD onlyIcelandIDA & IBRD totalIDA blendIDA onlyIDA totalIndiaIndonesiaIran, Islamic Rep.IraqIrelandIsraelItalyJamaicaJapanJordanKazakhstanKenyaKiribatiKorea, Dem. People’s Rep.Korea, Rep.KosovoKuwaitKyrgyz RepublicLao PDRLate-demographic dividendLatin America & Caribbean Latin America & Caribbean (excluding high income)Latin America & the Caribbean (IDA & IBRD countries)LatviaLeast developed countries: UN classificationLebanonLesothoLiberiaLibyaLiechtensteinLithuaniaLow & middle incomeLow incomeLower middle incomeLuxembourgMacao SAR, ChinaMacedonia, FYRMadagascarMalawiMalaysiaMaldivesMaliMaltaMarshall IslandsMauritaniaMauritiusMexicoMicronesia, Fed. Sts.Middle East & North AfricaMiddle East & North Africa (excluding high income)Middle East & North Africa (IDA & IBRD countries)Middle incomeMoldovaMonacoMongoliaMontenegroMoroccoMozambiqueMyanmarNamibiaNauruNepalNetherlandsNew CaledoniaNew ZealandNicaraguaNigerNigeriaNorth AmericaNorthern Mariana IslandsNorwayOECD membersOmanOther small statesPacific island small statesPakistanPalauPanamaPapua New GuineaParaguayPeruPhilippinesPolandPortugalPost-demographic dividendPre-demographic dividendPuerto RicoQatarRomaniaRussian FederationRwandaSamoaSan MarinoSao Tome and PrincipeSaudi ArabiaSenegalSerbiaSeychellesSierra LeoneSingaporeSlovak RepublicSloveniaSmall statesSolomon IslandsSomaliaSouth AfricaSouth AsiaSouth Asia (IDA & IBRD)South SudanSpainSri LankaSt. Kitts and NevisSt. LuciaSt. Vincent and the GrenadinesSub-Saharan Africa Sub-Saharan Africa (excluding high income)Sub-Saharan Africa (IDA & IBRD countries)SudanSurinameSwazilandSwedenSwitzerlandSyrian Arab RepublicTajikistanTanzaniaThailandTimor-LesteTogoTongaTrinidad and TobagoTunisiaTurkeyTurkmenistanTurks and Caicos IslandsTuvaluUgandaUkraineUnited Arab EmiratesUnited KingdomUnited StatesUpper middle incomeUruguayUzbekistanVanuatuVenezuela, RBVietnamVirgin Islands (U.S.)West Bank and GazaWorldYemen, Rep.ZambiaZimbabwe Timeline:
This timeline shows a graph from 1976 to 2016 of East Asia & Pacific. No data until 1975. Number of actual observations by date: 41.
Source name:
World Development Indicators
Source organization:
International Telecommunication Union, World Telecommunication/ICT Development Report and database, and World Bank estimates.
Categories, topics:
Infrastructure
Last updated:
apr 23, 2017
Indicators value changes by year
Minimum:
42.449 mln
jan 1, 1976
Maximum:
520.507 mln
jan 1, 2008
At the date of observation
Value
Absolute change
Change from previous value
jan 1, 1976
42.449 mln
+42.449 mln
0.0%
jan 1, 1977
45.447 mln
+2.998 mln
7.06%
jan 1, 1978
47.919 mln
+2.472 mln
5.44%
jan 1, 1979
50.608 mln
+2.689 mln
5.61%
jan 1, 1980
53.501 mln
+2.892 mln
5.72%
jan 1, 1981
56.471 mln
+2.97 mln
5.55%
jan 1, 1982
58.666 mln
+2.195 mln
3.89%
jan 1, 1983
62.11 mln
+3.445 mln
5.87%
jan 1, 1984
65.888 mln
+3.778 mln
6.08%
jan 1, 1985
69.076 mln
+3.188 mln
4.84%
jan 1, 1986
72.801 mln
+3.724 mln
5.39%
jan 1, 1987
76.858 mln
+4.058 mln
5.57%
jan 1, 1988
81.242 mln
+4.384 mln
5.7%
jan 1, 1989
86.963 mln
+5.721 mln
7.04%
jan 1, 1990
92.969 mln
+6.006 mln
6.91%
jan 1, 1991
99.405 mln
+6.436 mln
6.92%
jan 1, 1992
105.904 mln
+6.499 mln
6.54%
jan 1, 1993
113.367 mln
+7.463 mln
7.05%
jan 1, 1994
123.963 mln
+10.596 mln
9.35%
jan 1, 1995
140.006 mln
+16.043 mln
12.94%
jan 1, 1996
159.706 mln
+19.7 mln
14.07%
jan 1, 1997
180.99 mln
+21.285 mln
13.33%
jan 1, 1998
202.694 mln
+21.704 mln
11.99%
jan 1, 1999
219.035 mln
+16.341 mln
8.06%
jan 1, 2000
248.072 mln
+29.037 mln
13.26%
jan 1, 2001
287.161 mln
+39.09 mln
15.76%
jan 1, 2002
324.444 mln
+37.282 mln
12.98%
jan 1, 2003
360.379 mln
+35.935 mln
11.08%
jan 1, 2004
409.243 mln
+48.864 mln
13.56%
jan 1, 2005
464.477 mln
+55.234 mln
13.5%
jan 1, 2006
495.149 mln
+30.671 mln
6.6%
jan 1, 2007
519.104 mln
+23.955 mln
4.84%
jan 1, 2008
520.507 mln
+1.403 mln
0.27%
jan 1, 2009
508.617 mln
-11.89 mln
-2.28%
jan 1, 2010
512.863 mln
+4.246 mln
0.83%
jan 1, 2011
497.066 mln
-15.798 mln
-3.08%
jan 1, 2012
481.744 mln
-15.322 mln
-3.08%
jan 1, 2013
472.891 mln
-8.852 mln
-1.84%
jan 1, 2014
448.475 mln
-24.416 mln
-5.16%
jan 1, 2015
422.951 mln
-25.525 mln
-5.69%
jan 1, 2016
399.629 mln
-23.321 mln
-5.51%
Ranking of countries by current statistics by years


Comments: