29
/
en
AIzaSyAYiBZKx7MnpbEhh9jyipgxe19OcubqV5w
April 1, 2024
248687
Sri Lanka
LKA
true
2
1
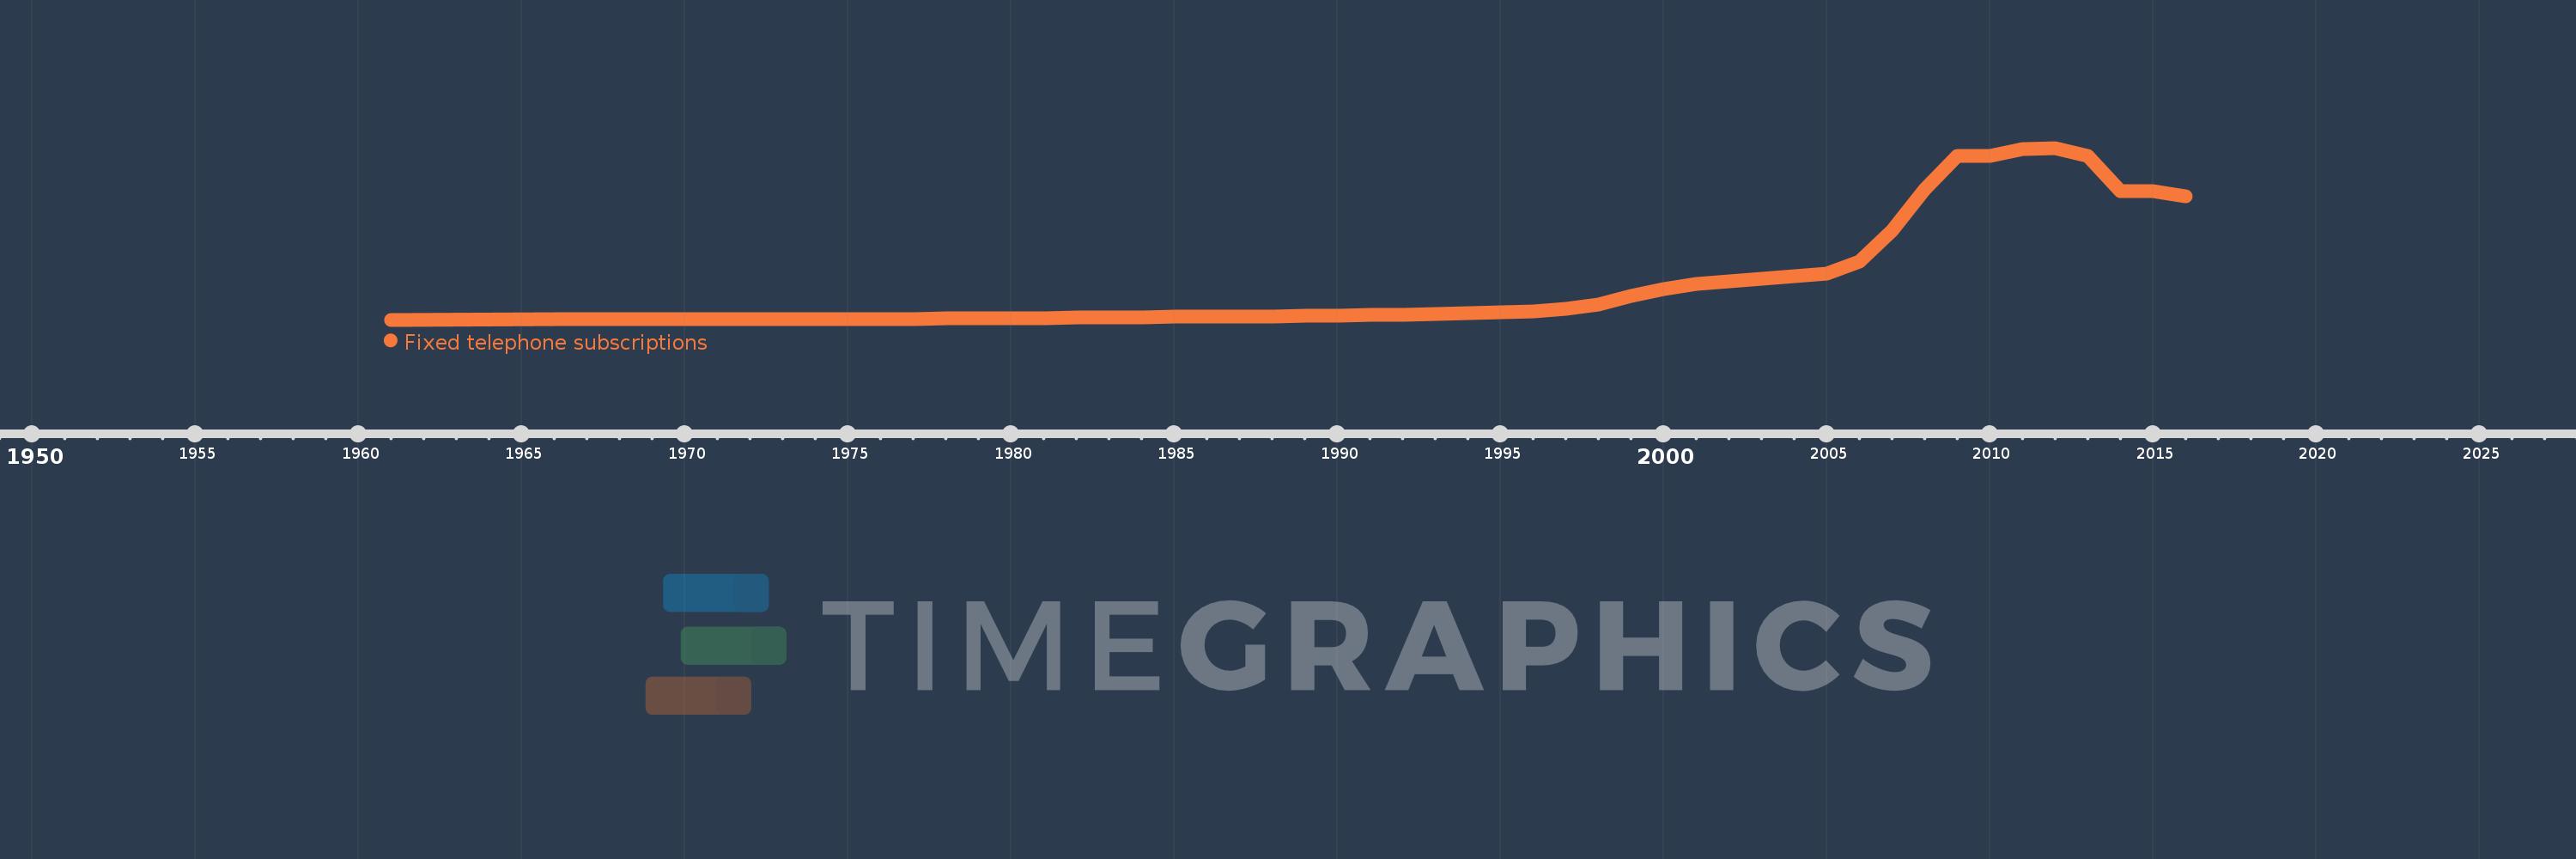
Fixed telephone subscriptions
2016,2015,2014,2013,2012,2011,2010,2009,2008,2007,2006,2005,2004,2003,2002,2001,2000,1999,1998,1997,1996,1995,1994,1993,1992,1991,1990,1989,1988,1987,1986,1985,1984,1983,1982,1981,1980,1979,1978,1977,1976,1971,1966,1961
This statistics in other country:
AfghanistanAlbaniaAlgeriaAmerican SamoaAndorraAngolaAntigua and BarbudaArab WorldArgentinaArmeniaArubaAustraliaAustriaAzerbaijanBahamas, TheBahrainBangladeshBarbadosBelarusBelgiumBelizeBeninBermudaBhutanBoliviaBosnia and HerzegovinaBotswanaBrazilBritish Virgin IslandsBrunei DarussalamBulgariaBurkina FasoBurundiCabo VerdeCambodiaCameroonCanadaCaribbean small statesCayman IslandsCentral African RepublicCentral Europe and the BalticsChadChileChinaColombiaComorosCongo, Dem. Rep.Congo, Rep.Costa RicaCote d'IvoireCroatiaCubaCuracaoCyprusCzech RepublicDenmarkDjiboutiDominicaDominican RepublicEarly-demographic dividendEast Asia & PacificEast Asia & Pacific (excluding high income)East Asia & Pacific (IDA & IBRD countries)EcuadorEgypt, Arab Rep.El SalvadorEquatorial GuineaEritreaEstoniaEthiopiaEuro areaEurope & Central AsiaEurope & Central Asia (excluding high income)Europe & Central Asia (IDA & IBRD countries)European UnionFaroe IslandsFijiFinlandFragile and conflict affected situationsFranceFrench PolynesiaGabonGambia, TheGeorgiaGermanyGhanaGibraltarGreeceGreenlandGrenadaGuamGuatemalaGuineaGuinea-BissauGuyanaHaitiHeavily indebted poor countries (HIPC)High incomeHondurasHong Kong SAR, ChinaHungaryIBRD onlyIcelandIDA & IBRD totalIDA blendIDA onlyIDA totalIndiaIndonesiaIran, Islamic Rep.IraqIrelandIsraelItalyJamaicaJapanJordanKazakhstanKenyaKiribatiKorea, Dem. People’s Rep.Korea, Rep.KosovoKuwaitKyrgyz RepublicLao PDRLate-demographic dividendLatin America & Caribbean Latin America & Caribbean (excluding high income)Latin America & the Caribbean (IDA & IBRD countries)LatviaLeast developed countries: UN classificationLebanonLesothoLiberiaLibyaLiechtensteinLithuaniaLow & middle incomeLow incomeLower middle incomeLuxembourgMacao SAR, ChinaMacedonia, FYRMadagascarMalawiMalaysiaMaldivesMaliMaltaMarshall IslandsMauritaniaMauritiusMexicoMicronesia, Fed. Sts.Middle East & North AfricaMiddle East & North Africa (excluding high income)Middle East & North Africa (IDA & IBRD countries)Middle incomeMoldovaMonacoMongoliaMontenegroMoroccoMozambiqueMyanmarNamibiaNauruNepalNetherlandsNew CaledoniaNew ZealandNicaraguaNigerNigeriaNorth AmericaNorthern Mariana IslandsNorwayOECD membersOmanOther small statesPacific island small statesPakistanPalauPanamaPapua New GuineaParaguayPeruPhilippinesPolandPortugalPost-demographic dividendPre-demographic dividendPuerto RicoQatarRomaniaRussian FederationRwandaSamoaSan MarinoSao Tome and PrincipeSaudi ArabiaSenegalSerbiaSeychellesSierra LeoneSingaporeSlovak RepublicSloveniaSmall statesSolomon IslandsSomaliaSouth AfricaSouth AsiaSouth Asia (IDA & IBRD)South SudanSpainSri LankaSt. Kitts and NevisSt. LuciaSt. Vincent and the GrenadinesSub-Saharan Africa Sub-Saharan Africa (excluding high income)Sub-Saharan Africa (IDA & IBRD countries)SudanSurinameSwazilandSwedenSwitzerlandSyrian Arab RepublicTajikistanTanzaniaThailandTimor-LesteTogoTongaTrinidad and TobagoTunisiaTurkeyTurkmenistanTurks and Caicos IslandsTuvaluUgandaUkraineUnited Arab EmiratesUnited KingdomUnited StatesUpper middle incomeUruguayUzbekistanVanuatuVenezuela, RBVietnamVirgin Islands (U.S.)West Bank and GazaWorldYemen, Rep.ZambiaZimbabwe Timeline:
This timeline shows a graph from 1961 to 2016 of Sri Lanka. No data until 1960. Number of actual observations by date: 44.
Source name:
World Development Indicators
Source organization:
International Telecommunication Union, World Telecommunication/ICT Development Report and database, and World Bank estimates.
Categories, topics:
Infrastructure
Last updated:
apr 23, 2017
Indicators value changes by year
Minimum:
22.772K
jan 1, 1961
Maximum:
3.608 mln
jan 1, 2012
At the date of observation
Value
Absolute change
Change from previous value
jan 1, 1961
22.772K
+22.772K
0.0%
jan 1, 1966
27.7K
+4.928K
21.64%
jan 1, 1971
37.1K
+9.4K
33.94%
jan 1, 1976
42.5K
+5.4K
14.56%
jan 1, 1977
43.55K
+1.05K
2.47%
jan 1, 1978
44.625K
+1.075K
2.47%
jan 1, 1979
45.7K
+1.075K
2.41%
jan 1, 1980
47.4K
+1.7K
3.72%
jan 1, 1981
54.2K
+6.8K
14.35%
jan 1, 1982
66.013K
+11.813K
21.8%
jan 1, 1983
70.381K
+4.368K
6.62%
jan 1, 1984
73.5K
+3.119K
4.43%
jan 1, 1985
80.77K
+7.27K
9.89%
jan 1, 1986
87.686K
+6.916K
8.56%
jan 1, 1987
92.065K
+4.379K
4.99%
jan 1, 1988
97.333K
+5.268K
5.72%
jan 1, 1989
103.521K
+6.188K
6.36%
jan 1, 1990
105.483K
+1.962K
1.9%
jan 1, 1991
121.388K
+15.905K
15.08%
jan 1, 1992
125.834K
+4.446K
3.66%
jan 1, 1993
135.504K
+9.67K
7.68%
jan 1, 1994
157.774K
+22.27K
16.43%
jan 1, 1995
180.724K
+22.95K
14.55%
jan 1, 1996
204.35K
+23.626K
13.07%
jan 1, 1997
255.049K
+50.699K
24.81%
jan 1, 1998
341.622K
+86.573K
33.94%
jan 1, 1999
523.529K
+181.907K
53.25%
jan 1, 2000
669.113K
+145.584K
27.81%
jan 1, 2001
767.411K
+98.298K
14.69%
jan 1, 2002
827.195K
+59.784K
7.79%
jan 1, 2003
883.108K
+55.913K
6.76%
jan 1, 2004
939.013K
+55.905K
6.33%
jan 1, 2005
991.239K
+52.226K
5.56%
jan 1, 2006
1.244 mln
+252.755K
25.5%
jan 1, 2007
1.884 mln
+640.084K
51.45%
jan 1, 2008
2.742 mln
+857.981K
45.54%
jan 1, 2009
3.446 mln
+704.352K
25.69%
jan 1, 2010
3.436 mln
-10.453K
-0.3%
jan 1, 2011
3.578 mln
+142.505K
4.15%
jan 1, 2012
3.608 mln
+29.929K
0.84%
jan 1, 2013
3.449 mln
-159.001K
-4.41%
jan 1, 2014
2.707 mln
-742.604K
-21.53%
jan 1, 2015
2.71 mln
+3.061K
0.11%
jan 1, 2016
2.601 mln
-108.652K
-4.01%
Ranking of countries by current statistics by years


Comments: