29
/
en
AIzaSyAYiBZKx7MnpbEhh9jyipgxe19OcubqV5w
April 1, 2024
245562
South Africa
ZAF
true
2
1
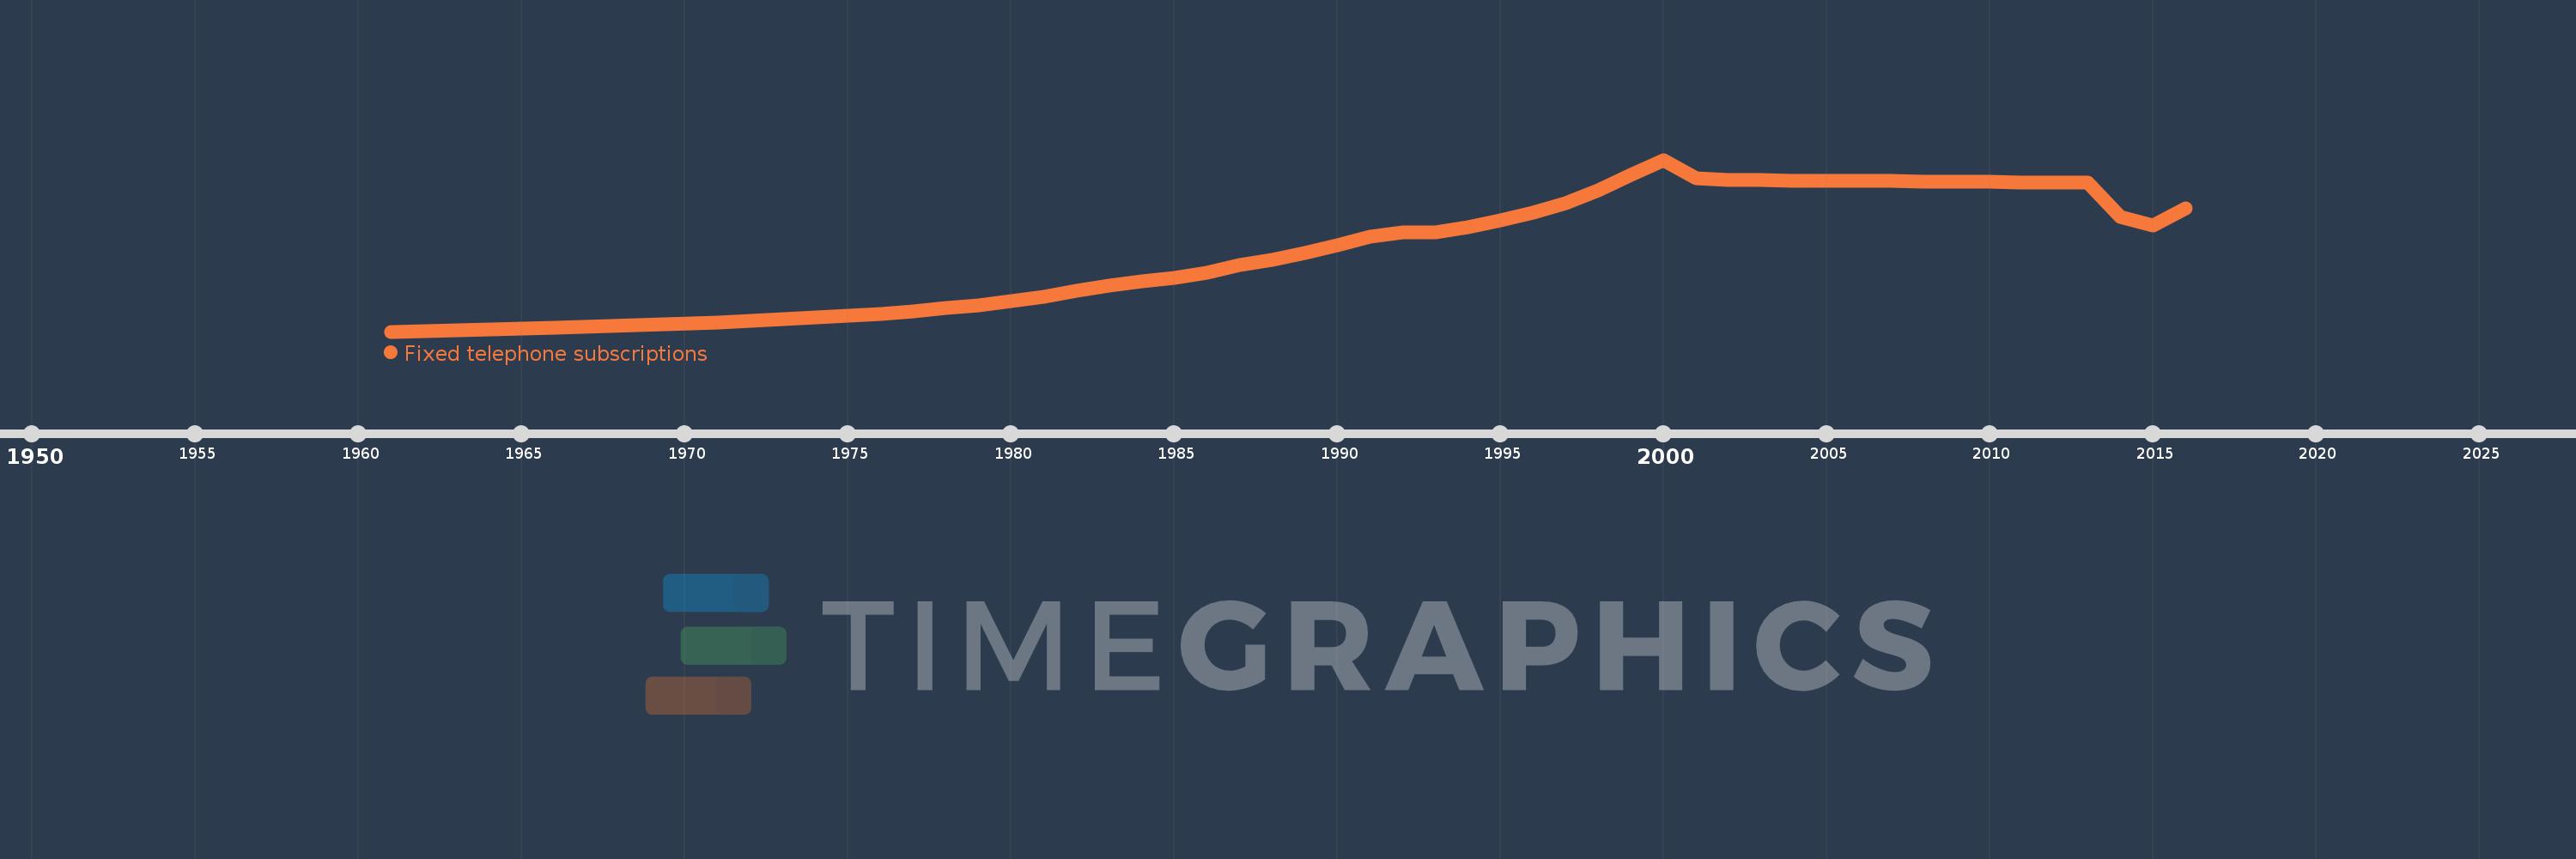
Fixed telephone subscriptions
2016,2015,2014,2013,2012,2011,2010,2009,2008,2007,2006,2005,2004,2003,2002,2001,2000,1999,1998,1997,1996,1995,1994,1993,1992,1991,1990,1989,1988,1987,1986,1985,1984,1983,1982,1981,1980,1979,1978,1977,1976,1971,1966,1961
This statistics in other country:
AfghanistanAlbaniaAlgeriaAmerican SamoaAndorraAngolaAntigua and BarbudaArab WorldArgentinaArmeniaArubaAustraliaAustriaAzerbaijanBahamas, TheBahrainBangladeshBarbadosBelarusBelgiumBelizeBeninBermudaBhutanBoliviaBosnia and HerzegovinaBotswanaBrazilBritish Virgin IslandsBrunei DarussalamBulgariaBurkina FasoBurundiCabo VerdeCambodiaCameroonCanadaCaribbean small statesCayman IslandsCentral African RepublicCentral Europe and the BalticsChadChileChinaColombiaComorosCongo, Dem. Rep.Congo, Rep.Costa RicaCote d'IvoireCroatiaCubaCuracaoCyprusCzech RepublicDenmarkDjiboutiDominicaDominican RepublicEarly-demographic dividendEast Asia & PacificEast Asia & Pacific (excluding high income)East Asia & Pacific (IDA & IBRD countries)EcuadorEgypt, Arab Rep.El SalvadorEquatorial GuineaEritreaEstoniaEthiopiaEuro areaEurope & Central AsiaEurope & Central Asia (excluding high income)Europe & Central Asia (IDA & IBRD countries)European UnionFaroe IslandsFijiFinlandFragile and conflict affected situationsFranceFrench PolynesiaGabonGambia, TheGeorgiaGermanyGhanaGibraltarGreeceGreenlandGrenadaGuamGuatemalaGuineaGuinea-BissauGuyanaHaitiHeavily indebted poor countries (HIPC)High incomeHondurasHong Kong SAR, ChinaHungaryIBRD onlyIcelandIDA & IBRD totalIDA blendIDA onlyIDA totalIndiaIndonesiaIran, Islamic Rep.IraqIrelandIsraelItalyJamaicaJapanJordanKazakhstanKenyaKiribatiKorea, Dem. People’s Rep.Korea, Rep.KosovoKuwaitKyrgyz RepublicLao PDRLate-demographic dividendLatin America & Caribbean Latin America & Caribbean (excluding high income)Latin America & the Caribbean (IDA & IBRD countries)LatviaLeast developed countries: UN classificationLebanonLesothoLiberiaLibyaLiechtensteinLithuaniaLow & middle incomeLow incomeLower middle incomeLuxembourgMacao SAR, ChinaMacedonia, FYRMadagascarMalawiMalaysiaMaldivesMaliMaltaMarshall IslandsMauritaniaMauritiusMexicoMicronesia, Fed. Sts.Middle East & North AfricaMiddle East & North Africa (excluding high income)Middle East & North Africa (IDA & IBRD countries)Middle incomeMoldovaMonacoMongoliaMontenegroMoroccoMozambiqueMyanmarNamibiaNauruNepalNetherlandsNew CaledoniaNew ZealandNicaraguaNigerNigeriaNorth AmericaNorthern Mariana IslandsNorwayOECD membersOmanOther small statesPacific island small statesPakistanPalauPanamaPapua New GuineaParaguayPeruPhilippinesPolandPortugalPost-demographic dividendPre-demographic dividendPuerto RicoQatarRomaniaRussian FederationRwandaSamoaSan MarinoSao Tome and PrincipeSaudi ArabiaSenegalSerbiaSeychellesSierra LeoneSingaporeSlovak RepublicSloveniaSmall statesSolomon IslandsSomaliaSouth AfricaSouth AsiaSouth Asia (IDA & IBRD)South SudanSpainSri LankaSt. Kitts and NevisSt. LuciaSt. Vincent and the GrenadinesSub-Saharan Africa Sub-Saharan Africa (excluding high income)Sub-Saharan Africa (IDA & IBRD countries)SudanSurinameSwazilandSwedenSwitzerlandSyrian Arab RepublicTajikistanTanzaniaThailandTimor-LesteTogoTongaTrinidad and TobagoTunisiaTurkeyTurkmenistanTurks and Caicos IslandsTuvaluUgandaUkraineUnited Arab EmiratesUnited KingdomUnited StatesUpper middle incomeUruguayUzbekistanVanuatuVenezuela, RBVietnamVirgin Islands (U.S.)West Bank and GazaWorldYemen, Rep.ZambiaZimbabwe Timeline:
This timeline shows a graph from 1961 to 2016 of South Africa. No data until 1960. Number of actual observations by date: 44.
Source name:
World Development Indicators
Source organization:
International Telecommunication Union, World Telecommunication/ICT Development Report and database, and World Bank estimates.
Categories, topics:
Infrastructure
Last updated:
apr 23, 2017
Indicators value changes by year
Minimum:
650.013K
jan 1, 1961
Maximum:
5.493 mln
jan 1, 2000
At the date of observation
Value
Absolute change
Change from previous value
jan 1, 1961
650.013K
+650.013K
0.0%
jan 1, 1966
755.0K
+104.987K
16.15%
jan 1, 1971
916.0K
+161.0K
21.32%
jan 1, 1976
1.156 mln
+240.0K
26.2%
jan 1, 1977
1.229 mln
+73.0K
6.31%
jan 1, 1978
1.31 mln
+81.0K
6.59%
jan 1, 1979
1.398 mln
+88.0K
6.72%
jan 1, 1980
1.508 mln
+110.0K
7.87%
jan 1, 1981
1.632 mln
+124.0K
8.22%
jan 1, 1982
1.789 mln
+156.61K
9.6%
jan 1, 1983
1.937 mln
+148.01K
8.28%
jan 1, 1984
2.072 mln
+135.197K
6.98%
jan 1, 1985
2.153 mln
+81.142K
3.92%
jan 1, 1986
2.298 mln
+144.814K
6.73%
jan 1, 1987
2.533 mln
+234.907K
10.22%
jan 1, 1988
2.669 mln
+135.909K
5.37%
jan 1, 1989
2.866 mln
+197.435K
7.4%
jan 1, 1990
3.08 mln
+214.309K
7.48%
jan 1, 1991
3.315 mln
+234.689K
7.62%
jan 1, 1992
3.435 mln
+119.766K
3.61%
jan 1, 1993
3.458 mln
+23.338K
0.68%
jan 1, 1994
3.594 mln
+135.725K
3.92%
jan 1, 1995
3.775 mln
+181.504K
5.05%
jan 1, 1996
4.002 mln
+226.825K
6.01%
jan 1, 1997
4.259 mln
+256.459K
6.41%
jan 1, 1998
4.645 mln
+386.426K
9.07%
jan 1, 1999
5.075 mln
+430.352K
9.26%
jan 1, 2000
5.493 mln
+417.421K
8.22%
jan 1, 2001
4.962 mln
-531.095K
-9.67%
jan 1, 2002
4.924 mln
-37.285K
-0.75%
jan 1, 2003
4.917 mln
-7.458K
-0.15%
jan 1, 2004
4.91 mln
-7.0K
-0.14%
jan 1, 2005
4.903 mln
-7.0K
-0.14%
jan 1, 2006
4.896 mln
-7.0K
-0.14%
jan 1, 2007
4.889 mln
-7.0K
-0.14%
jan 1, 2008
4.882 mln
-7.0K
-0.14%
jan 1, 2009
4.875 mln
-7.0K
-0.14%
jan 1, 2010
4.868 mln
-7.0K
-0.14%
jan 1, 2011
4.861 mln
-7.0K
-0.14%
jan 1, 2012
4.854 mln
-7.0K
-0.14%
jan 1, 2013
4.847 mln
-7.0K
-0.14%
jan 1, 2014
3.876 mln
-971.418K
-20.04%
jan 1, 2015
3.648 mln
-227.812K
-5.88%
jan 1, 2016
4.131 mln
+483.285K
13.25%
Ranking of countries by current statistics by years


Comments: