29
/
en
AIzaSyAYiBZKx7MnpbEhh9jyipgxe19OcubqV5w
April 1, 2024
207913
Netherlands
NLD
true
2
1
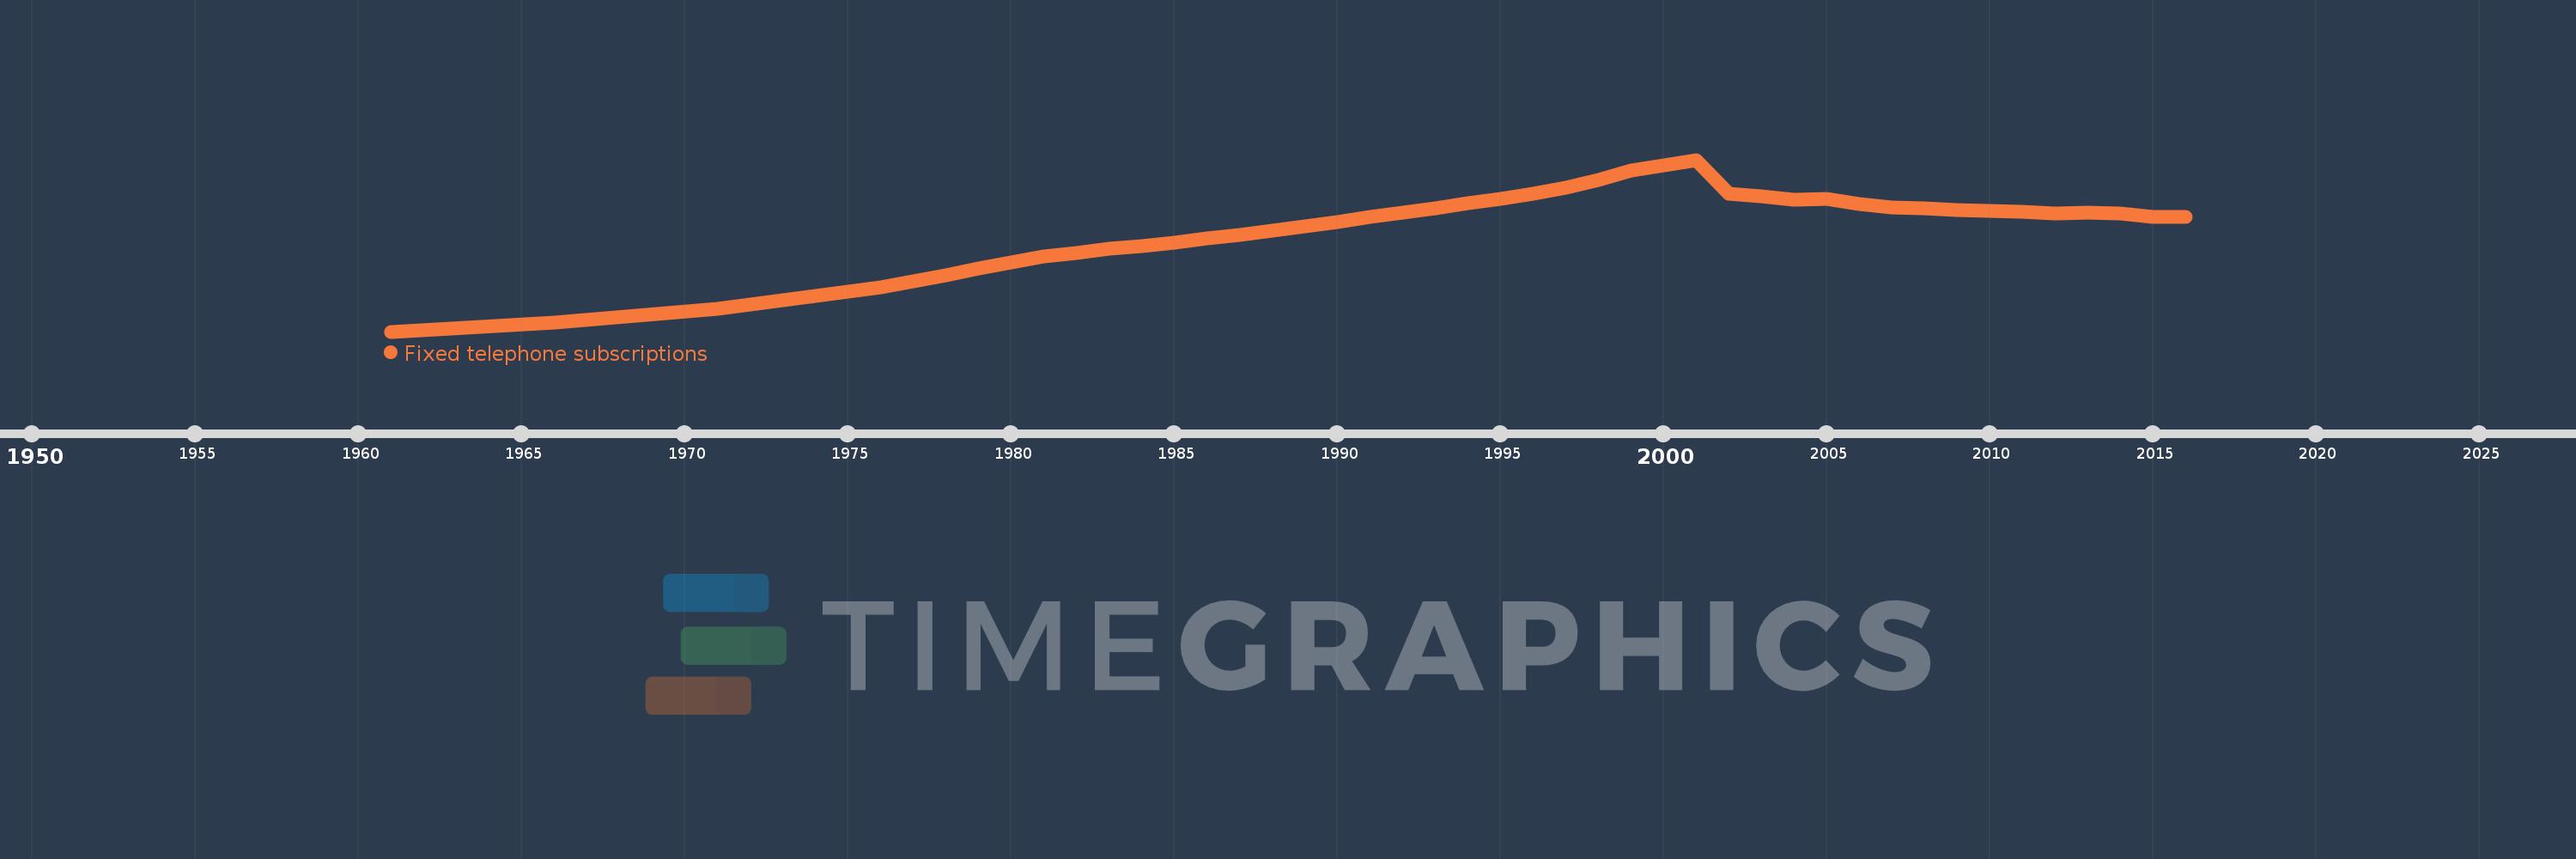
Fixed telephone subscriptions
2016,2015,2014,2013,2012,2011,2010,2009,2008,2007,2006,2005,2004,2003,2002,2001,2000,1999,1998,1997,1996,1995,1994,1993,1992,1991,1990,1989,1988,1987,1986,1985,1984,1983,1982,1981,1980,1979,1978,1977,1976,1971,1966,1961
This statistics in other country:
AfghanistanAlbaniaAlgeriaAmerican SamoaAndorraAngolaAntigua and BarbudaArab WorldArgentinaArmeniaArubaAustraliaAustriaAzerbaijanBahamas, TheBahrainBangladeshBarbadosBelarusBelgiumBelizeBeninBermudaBhutanBoliviaBosnia and HerzegovinaBotswanaBrazilBritish Virgin IslandsBrunei DarussalamBulgariaBurkina FasoBurundiCabo VerdeCambodiaCameroonCanadaCaribbean small statesCayman IslandsCentral African RepublicCentral Europe and the BalticsChadChileChinaColombiaComorosCongo, Dem. Rep.Congo, Rep.Costa RicaCote d'IvoireCroatiaCubaCuracaoCyprusCzech RepublicDenmarkDjiboutiDominicaDominican RepublicEarly-demographic dividendEast Asia & PacificEast Asia & Pacific (excluding high income)East Asia & Pacific (IDA & IBRD countries)EcuadorEgypt, Arab Rep.El SalvadorEquatorial GuineaEritreaEstoniaEthiopiaEuro areaEurope & Central AsiaEurope & Central Asia (excluding high income)Europe & Central Asia (IDA & IBRD countries)European UnionFaroe IslandsFijiFinlandFragile and conflict affected situationsFranceFrench PolynesiaGabonGambia, TheGeorgiaGermanyGhanaGibraltarGreeceGreenlandGrenadaGuamGuatemalaGuineaGuinea-BissauGuyanaHaitiHeavily indebted poor countries (HIPC)High incomeHondurasHong Kong SAR, ChinaHungaryIBRD onlyIcelandIDA & IBRD totalIDA blendIDA onlyIDA totalIndiaIndonesiaIran, Islamic Rep.IraqIrelandIsraelItalyJamaicaJapanJordanKazakhstanKenyaKiribatiKorea, Dem. People’s Rep.Korea, Rep.KosovoKuwaitKyrgyz RepublicLao PDRLate-demographic dividendLatin America & Caribbean Latin America & Caribbean (excluding high income)Latin America & the Caribbean (IDA & IBRD countries)LatviaLeast developed countries: UN classificationLebanonLesothoLiberiaLibyaLiechtensteinLithuaniaLow & middle incomeLow incomeLower middle incomeLuxembourgMacao SAR, ChinaMacedonia, FYRMadagascarMalawiMalaysiaMaldivesMaliMaltaMarshall IslandsMauritaniaMauritiusMexicoMicronesia, Fed. Sts.Middle East & North AfricaMiddle East & North Africa (excluding high income)Middle East & North Africa (IDA & IBRD countries)Middle incomeMoldovaMonacoMongoliaMontenegroMoroccoMozambiqueMyanmarNamibiaNauruNepalNetherlandsNew CaledoniaNew ZealandNicaraguaNigerNigeriaNorth AmericaNorthern Mariana IslandsNorwayOECD membersOmanOther small statesPacific island small statesPakistanPalauPanamaPapua New GuineaParaguayPeruPhilippinesPolandPortugalPost-demographic dividendPre-demographic dividendPuerto RicoQatarRomaniaRussian FederationRwandaSamoaSan MarinoSao Tome and PrincipeSaudi ArabiaSenegalSerbiaSeychellesSierra LeoneSingaporeSlovak RepublicSloveniaSmall statesSolomon IslandsSomaliaSouth AfricaSouth AsiaSouth Asia (IDA & IBRD)South SudanSpainSri LankaSt. Kitts and NevisSt. LuciaSt. Vincent and the GrenadinesSub-Saharan Africa Sub-Saharan Africa (excluding high income)Sub-Saharan Africa (IDA & IBRD countries)SudanSurinameSwazilandSwedenSwitzerlandSyrian Arab RepublicTajikistanTanzaniaThailandTimor-LesteTogoTongaTrinidad and TobagoTunisiaTurkeyTurkmenistanTurks and Caicos IslandsTuvaluUgandaUkraineUnited Arab EmiratesUnited KingdomUnited StatesUpper middle incomeUruguayUzbekistanVanuatuVenezuela, RBVietnamVirgin Islands (U.S.)West Bank and GazaWorldYemen, Rep.ZambiaZimbabwe Timeline:
This timeline shows a graph from 1961 to 2016 of Netherlands. No data until 1960. Number of actual observations by date: 44.
Source name:
World Development Indicators
Source organization:
International Telecommunication Union, World Telecommunication/ICT Development Report and database, and World Bank estimates.
Categories, topics:
Infrastructure
Last updated:
apr 23, 2017
Indicators value changes by year
Minimum:
1.044 mln
jan 1, 1961
Maximum:
9.889 mln
jan 1, 2001
At the date of observation
Value
Absolute change
Change from previous value
jan 1, 1961
1.044 mln
+1.044 mln
0.0%
jan 1, 1966
1.504 mln
+460.344K
44.11%
jan 1, 1971
2.202 mln
+698.0K
46.41%
jan 1, 1976
3.336 mln
+1.133 mln
51.48%
jan 1, 1977
3.612 mln
+276.6K
8.29%
jan 1, 1978
3.933 mln
+320.7K
8.88%
jan 1, 1979
4.28 mln
+347.1K
8.83%
jan 1, 1980
4.605 mln
+324.9K
7.59%
jan 1, 1981
4.892 mln
+287.3K
6.24%
jan 1, 1982
5.103 mln
+211.2K
4.32%
jan 1, 1983
5.291 mln
+187.7K
3.68%
jan 1, 1984
5.462 mln
+171.0K
3.23%
jan 1, 1985
5.643 mln
+181.0K
3.31%
jan 1, 1986
5.823 mln
+180.0K
3.19%
jan 1, 1987
6.029 mln
+206.0K
3.54%
jan 1, 1988
6.234 mln
+205.0K
3.4%
jan 1, 1989
6.466 mln
+232.0K
3.72%
jan 1, 1990
6.69 mln
+224.0K
3.46%
jan 1, 1991
6.94 mln
+250.0K
3.74%
jan 1, 1992
7.175 mln
+235.0K
3.39%
jan 1, 1993
7.395 mln
+220.0K
3.07%
jan 1, 1994
7.634 mln
+239.0K
3.23%
jan 1, 1995
7.859 mln
+225.0K
2.95%
jan 1, 1996
8.124 mln
+265.0K
3.37%
jan 1, 1997
8.431 mln
+307.0K
3.78%
jan 1, 1998
8.86 mln
+429.0K
5.09%
jan 1, 1999
9.337 mln
+477.0K
5.38%
jan 1, 2000
9.613 mln
+276.0K
2.96%
jan 1, 2001
9.889 mln
+276.0K
2.87%
jan 1, 2002
8.158 mln
-1.731 mln
-17.5%
jan 1, 2003
8.026 mln
-132.0K
-1.62%
jan 1, 2004
7.846 mln
-180.0K
-2.24%
jan 1, 2005
7.861 mln
+15.0K
0.19%
jan 1, 2006
7.6 mln
-261.0K
-3.32%
jan 1, 2007
7.45 mln
-150.0K
-1.97%
jan 1, 2008
7.404 mln
-45.7K
-0.61%
jan 1, 2009
7.317 mln
-87.1K
-1.18%
jan 1, 2010
7.256 mln
-61.2K
-0.84%
jan 1, 2011
7.232 mln
-24.0K
-0.33%
jan 1, 2012
7.133 mln
-99.0K
-1.37%
jan 1, 2013
7.182 mln
+49.0K
0.69%
jan 1, 2014
7.125 mln
-56.514K
-0.79%
jan 1, 2015
6.946 mln
-179.486K
-2.52%
jan 1, 2016
6.952 mln
+5.528K
0.08%
Ranking of countries by current statistics by years


Comments: