29
/
en
AIzaSyAYiBZKx7MnpbEhh9jyipgxe19OcubqV5w
April 1, 2024
255149
Swaziland
SWZ
true
2
1
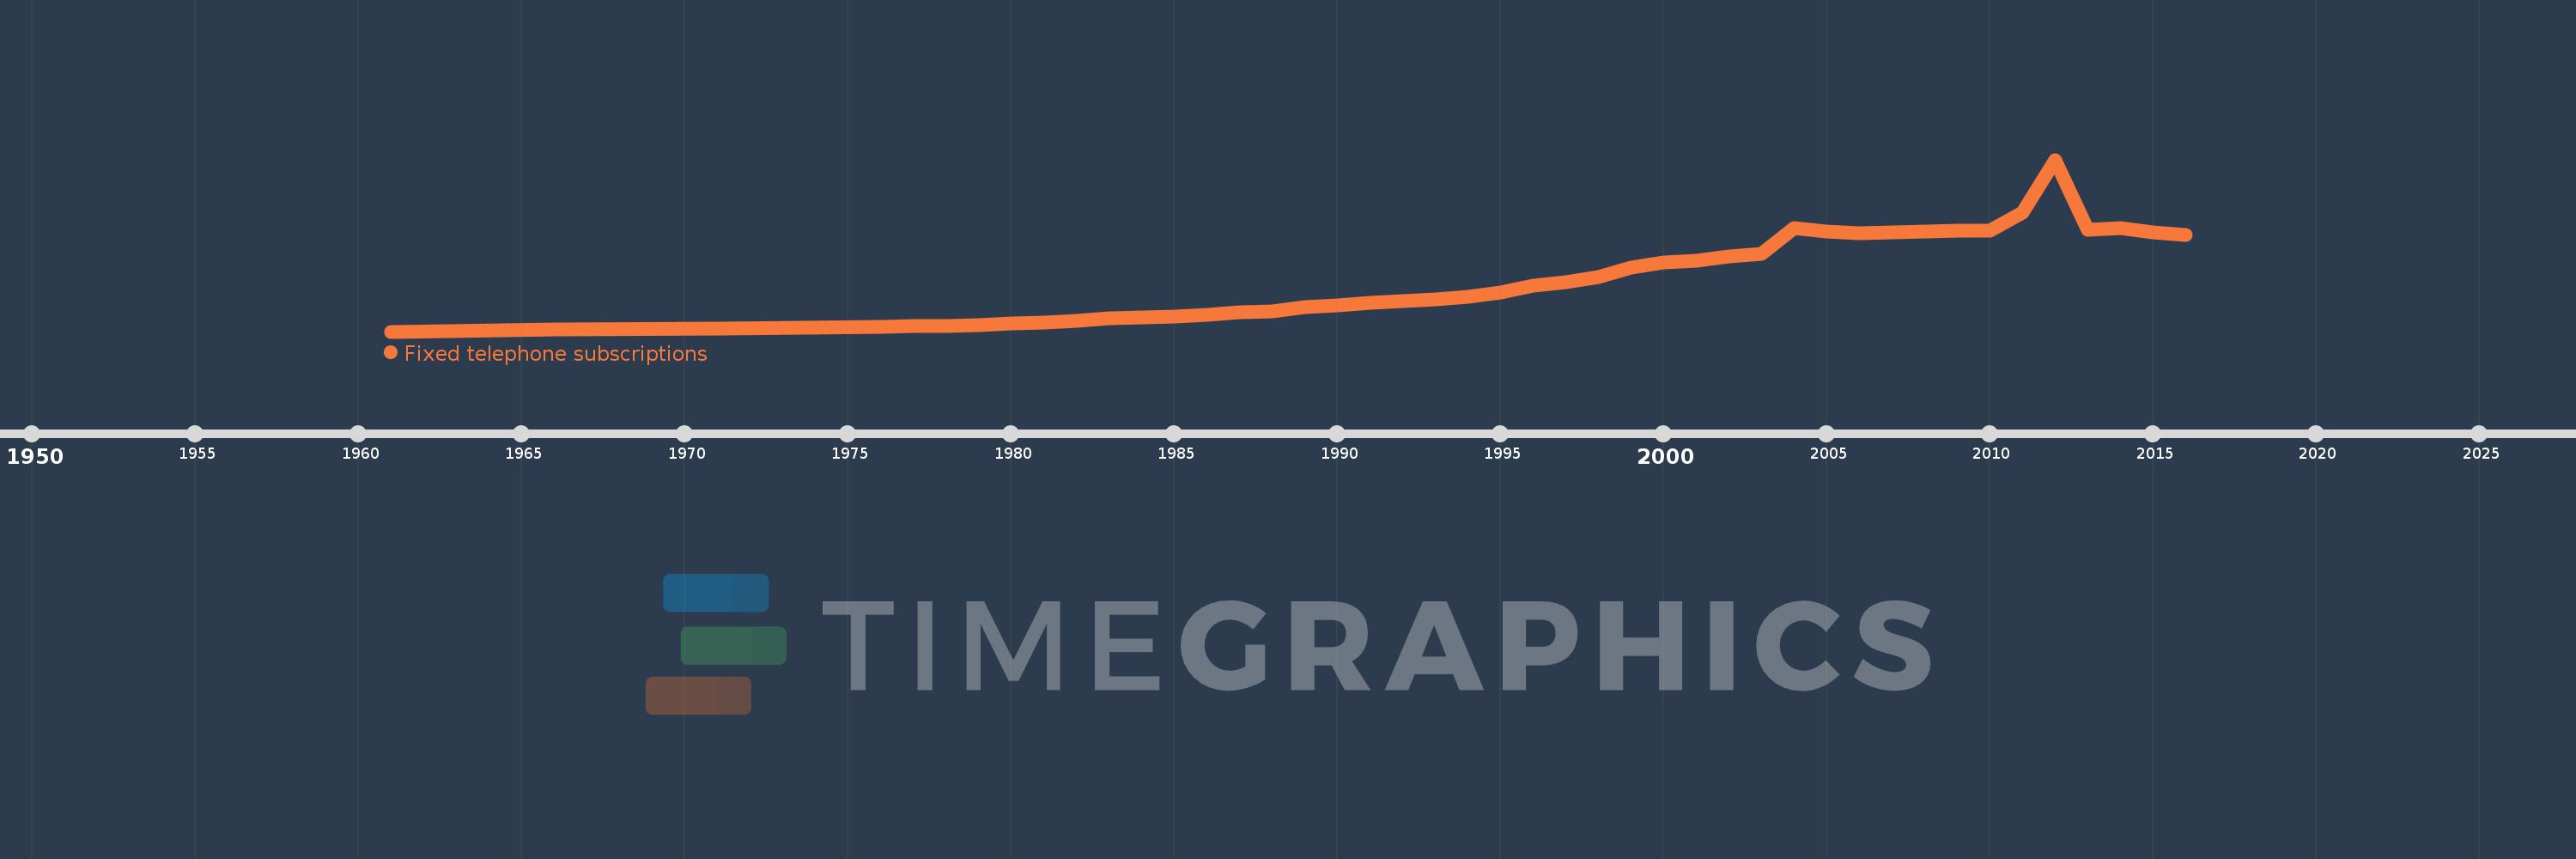
Fixed telephone subscriptions
2016,2015,2014,2013,2012,2011,2010,2009,2008,2007,2006,2005,2004,2003,2002,2001,2000,1999,1998,1997,1996,1995,1994,1993,1992,1991,1990,1989,1988,1987,1986,1985,1984,1983,1982,1981,1980,1979,1978,1977,1976,1971,1966,1961
This statistics in other country:
AfghanistanAlbaniaAlgeriaAmerican SamoaAndorraAngolaAntigua and BarbudaArab WorldArgentinaArmeniaArubaAustraliaAustriaAzerbaijanBahamas, TheBahrainBangladeshBarbadosBelarusBelgiumBelizeBeninBermudaBhutanBoliviaBosnia and HerzegovinaBotswanaBrazilBritish Virgin IslandsBrunei DarussalamBulgariaBurkina FasoBurundiCabo VerdeCambodiaCameroonCanadaCaribbean small statesCayman IslandsCentral African RepublicCentral Europe and the BalticsChadChileChinaColombiaComorosCongo, Dem. Rep.Congo, Rep.Costa RicaCote d'IvoireCroatiaCubaCuracaoCyprusCzech RepublicDenmarkDjiboutiDominicaDominican RepublicEarly-demographic dividendEast Asia & PacificEast Asia & Pacific (excluding high income)East Asia & Pacific (IDA & IBRD countries)EcuadorEgypt, Arab Rep.El SalvadorEquatorial GuineaEritreaEstoniaEthiopiaEuro areaEurope & Central AsiaEurope & Central Asia (excluding high income)Europe & Central Asia (IDA & IBRD countries)European UnionFaroe IslandsFijiFinlandFragile and conflict affected situationsFranceFrench PolynesiaGabonGambia, TheGeorgiaGermanyGhanaGibraltarGreeceGreenlandGrenadaGuamGuatemalaGuineaGuinea-BissauGuyanaHaitiHeavily indebted poor countries (HIPC)High incomeHondurasHong Kong SAR, ChinaHungaryIBRD onlyIcelandIDA & IBRD totalIDA blendIDA onlyIDA totalIndiaIndonesiaIran, Islamic Rep.IraqIrelandIsraelItalyJamaicaJapanJordanKazakhstanKenyaKiribatiKorea, Dem. People’s Rep.Korea, Rep.KosovoKuwaitKyrgyz RepublicLao PDRLate-demographic dividendLatin America & Caribbean Latin America & Caribbean (excluding high income)Latin America & the Caribbean (IDA & IBRD countries)LatviaLeast developed countries: UN classificationLebanonLesothoLiberiaLibyaLiechtensteinLithuaniaLow & middle incomeLow incomeLower middle incomeLuxembourgMacao SAR, ChinaMacedonia, FYRMadagascarMalawiMalaysiaMaldivesMaliMaltaMarshall IslandsMauritaniaMauritiusMexicoMicronesia, Fed. Sts.Middle East & North AfricaMiddle East & North Africa (excluding high income)Middle East & North Africa (IDA & IBRD countries)Middle incomeMoldovaMonacoMongoliaMontenegroMoroccoMozambiqueMyanmarNamibiaNauruNepalNetherlandsNew CaledoniaNew ZealandNicaraguaNigerNigeriaNorth AmericaNorthern Mariana IslandsNorwayOECD membersOmanOther small statesPacific island small statesPakistanPalauPanamaPapua New GuineaParaguayPeruPhilippinesPolandPortugalPost-demographic dividendPre-demographic dividendPuerto RicoQatarRomaniaRussian FederationRwandaSamoaSan MarinoSao Tome and PrincipeSaudi ArabiaSenegalSerbiaSeychellesSierra LeoneSingaporeSlovak RepublicSloveniaSmall statesSolomon IslandsSomaliaSouth AfricaSouth AsiaSouth Asia (IDA & IBRD)South SudanSpainSri LankaSt. Kitts and NevisSt. LuciaSt. Vincent and the GrenadinesSub-Saharan Africa Sub-Saharan Africa (excluding high income)Sub-Saharan Africa (IDA & IBRD countries)SudanSurinameSwazilandSwedenSwitzerlandSyrian Arab RepublicTajikistanTanzaniaThailandTimor-LesteTogoTongaTrinidad and TobagoTunisiaTurkeyTurkmenistanTurks and Caicos IslandsTuvaluUgandaUkraineUnited Arab EmiratesUnited KingdomUnited StatesUpper middle incomeUruguayUzbekistanVanuatuVenezuela, RBVietnamVirgin Islands (U.S.)West Bank and GazaWorldYemen, Rep.ZambiaZimbabwe Timeline:
This timeline shows a graph from 1961 to 2016 of Swaziland. No data until 1960. Number of actual observations by date: 44.
Source name:
World Development Indicators
Source organization:
International Telecommunication Union, World Telecommunication/ICT Development Report and database, and World Bank estimates.
Categories, topics:
Infrastructure
Last updated:
apr 23, 2017
Indicators value changes by year
Maximum:
75.825K
jan 1, 2012
At the date of observation
Value
Absolute change
Change from previous value
jan 1, 1961
1.2K
+1.2K
0.0%
jan 1, 1966
2.0K
+800.0
66.67%
jan 1, 1971
2.5K
+500.0
25.0%
jan 1, 1976
3.358K
+858.0
34.32%
jan 1, 1977
3.55K
+192.0
5.72%
jan 1, 1978
3.6K
+50.0
1.41%
jan 1, 1979
3.9K
+300.0
8.33%
jan 1, 1980
4.6K
+700.0
17.95%
jan 1, 1981
5.21K
+610.0
13.26%
jan 1, 1982
6.039K
+829.0
15.91%
jan 1, 1983
6.939K
+900.0
14.9%
jan 1, 1984
7.43K
+491.0
7.08%
jan 1, 1985
7.9K
+470.0
6.33%
jan 1, 1986
8.3K
+400.0
5.06%
jan 1, 1987
9.44K
+1.14K
13.73%
jan 1, 1988
9.816K
+376.0
3.98%
jan 1, 1989
11.8K
+1.984K
20.21%
jan 1, 1990
12.5K
+700.0
5.93%
jan 1, 1991
13.6K
+1.1K
8.8%
jan 1, 1992
14.35K
+750.0
5.51%
jan 1, 1993
15.17K
+820.0
5.71%
jan 1, 1994
16.338K
+1.168K
7.7%
jan 1, 1995
18.189K
+1.851K
11.33%
jan 1, 1996
21.13K
+2.941K
16.17%
jan 1, 1997
22.602K
+1.472K
6.97%
jan 1, 1998
25.073K
+2.471K
10.93%
jan 1, 1999
28.999K
+3.926K
15.66%
jan 1, 2000
31.314K
+2.315K
7.98%
jan 1, 2001
31.858K
+544.0
1.74%
jan 1, 2002
33.739K
+1.881K
5.9%
jan 1, 2003
35.06K
+1.321K
3.92%
jan 1, 2004
46.199K
+11.139K
31.77%
jan 1, 2005
44.507K
-1.692K
-3.66%
jan 1, 2006
44.091K
-416.0
-0.93%
jan 1, 2007
44.287K
+196.0
0.44%
jan 1, 2008
44.849K
+562.0
1.27%
jan 1, 2009
45.162K
+313.0
0.7%
jan 1, 2010
45.162K
0.0
0.0%
jan 1, 2011
52.966K
+7.804K
17.28%
jan 1, 2012
75.825K
+22.859K
43.16%
jan 1, 2013
45.565K
-30.26K
-39.91%
jan 1, 2014
46.0K
+435.0
0.95%
jan 1, 2015
44.4K
-1.6K
-3.48%
jan 1, 2016
43.0K
-1.4K
-3.15%
Ranking of countries by current statistics by years


Comments: